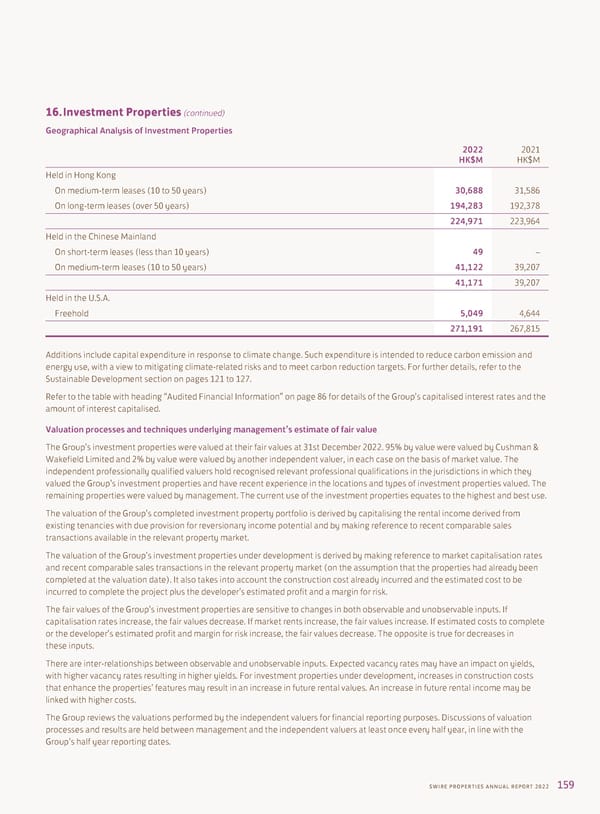
16. Investment Properties (continued) Geographical Analysis of Investment Properties 2022 2021 HK$M HK$M Held in Hong Kong On medium-term leases (10 to 50 years) 30,688 31,586 On long-term leases (over 50 years) 194,283 192,378 224,971 223,964 Held in the Chinese Mainland On short-term leases (less than 10 years) 49 – On medium-term leases (10 to 50 years) 41,122 39,207 41,171 39,207 Held in the U.S.A. Freehold 5,049 4,644 271,191 267,815 Additions include capital expenditure in response to climate change. Such expenditure is intended to reduce carbon emission and energy use, with a view to mitigating climate-related risks and to meet carbon reduction targets. For further details, refer to the Sustainable Development section on pages 121 to 127. Refer to the table with heading “Audited Financial Information” on page 86 for details of the Group’s capitalised interest rates and the amount of interest capitalised. Valuation processes and techniques underlying management’s estimate of fair value The Group’s investment properties were valued at their fair values at 31st December 2022. 95% by value were valued by Cushman & Wakefield Limited and 2% by value were valued by another independent valuer, in each case on the basis of market value. The independent professionally qualified valuers hold recognised relevant professional qualifications in the jurisdictions in which they valued the Group’s investment properties and have recent experience in the locations and types of investment properties valued. The remaining properties were valued by management. The current use of the investment properties equates to the highest and best use. The valuation of the Group’s completed investment property portfolio is derived by capitalising the rental income derived from existing tenancies with due provision for reversionary income potential and by making reference to recent comparable sales transactions available in the relevant property market. The valuation of the Group’s investment properties under development is derived by making reference to market capitalisation rates and recent comparable sales transactions in the relevant property market (on the assumption that the properties had already been completed at the valuation date). It also takes into account the construction cost already incurred and the estimated cost to be incurred to complete the project plus the developer’s estimated profit and a margin for risk. The fair values of the Group’s investment properties are sensitive to changes in both observable and unobservable inputs. If capitalisation rates increase, the fair values decrease. If market rents increase, the fair values increase. If estimated costs to complete or the developer’s estimated profit and margin for risk increase, the fair values decrease. The opposite is true for decreases in these inputs. There are inter-relationships between observable and unobservable inputs. Expected vacancy rates may have an impact on yields, with higher vacancy rates resulting in higher yields. For investment properties under development, increases in construction costs that enhance the properties’ features may result in an increase in future rental values. An increase in future rental income may be linked with higher costs. The Group reviews the valuations performed by the independent valuers for financial reporting purposes. Discussions of valuation processes and results are held between management and the independent valuers at least once every half year, in line with the Group’s half year reporting dates. SWIRE PROPERTIES ANNUAL REPORT 2022 159
 Annual Report 2022 Page 160 Page 162