
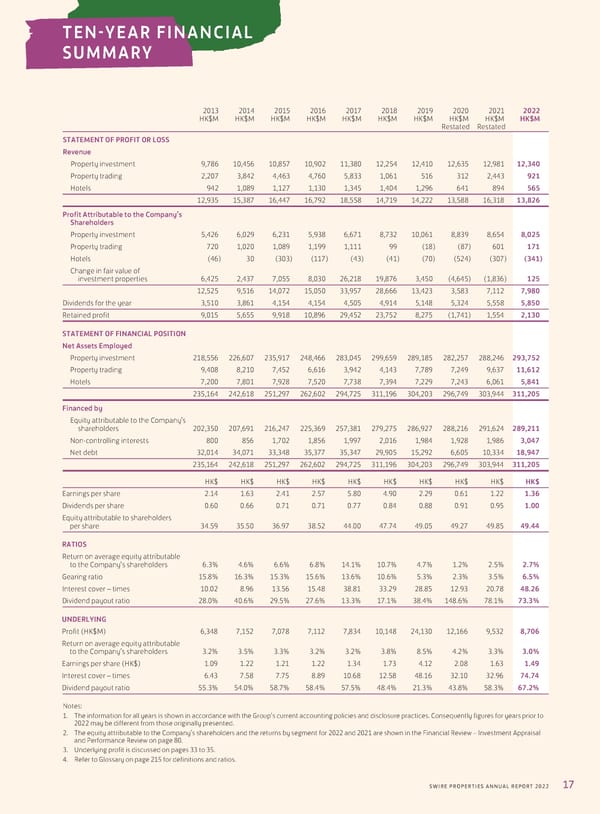
TEN-YEAR FINANCIAL SUMMARY 2013 2014 2015 2016 2017 2018 2019 2020 2021 2022 HK$M HK$M HK$M HK$M HK$M HK$M HK$M HK$M HK$M HK$M Restated Restated STATEMENT OF PROFIT OR LOSS Revenue Property investment 9,786 10,456 10,857 10,902 11,380 12,254 12,410 12,635 12,981 12,340 Property trading 2,207 3,842 4,463 4,760 5,833 1,061 516 312 2,443 921 Hotels 942 1,089 1,127 1,130 1,345 1,404 1,296 641 894 565 12,935 15,387 16,447 16,792 18,558 14,719 14,222 13,588 16,318 13,826 Profit Attributable to the Company’s Shareholders Property investment 5,426 6,029 6,231 5,938 6,671 8,732 10,061 8,839 8,654 8,025 Property trading 720 1,020 1,089 1,199 1,111 99 (18) (87) 601 171 Hotels (46) 30 (303) (117) (43) (41) (70) (524) (307) (341) Change in fair value of investment properties 6,425 2,437 7,055 8,030 26,218 19,876 3,450 (4,645) (1,836) 125 12,525 9,516 14,072 15,050 33,957 28,666 13,423 3,583 7,112 7,980 Dividends for the year 3,510 3,861 4,154 4,154 4,505 4,914 5,148 5,324 5,558 5,850 Retained profit 9,015 5,655 9,918 10,896 29,452 23,752 8,275 (1,741) 1,554 2,130 STATEMENT OF FINANCIAL POSITION Net Assets Employed Property investment 218,556 226,607 235,917 248,466 283,045 299,659 289,185 282,257 288,246 293,752 Property trading 9,408 8,210 7,452 6,616 3,942 4,143 7,789 7,249 9,637 11,612 Hotels 7,200 7,801 7,928 7,520 7,738 7,394 7,229 7,243 6,061 5,841 235,164 242,618 251,297 262,602 294,725 311,196 304,203 296,749 303,944 311,205 Financed by Equity attributable to the Company’s shareholders 202,350 207,691 216,247 225,369 257,381 279,275 286,927 288,216 291,624 289,211 Non-controlling interests 800 856 1,702 1,856 1,997 2,016 1,984 1,928 1,986 3,047 Net debt 32,014 34,071 33,348 35,377 35,347 29,905 15,292 6,605 10,334 18,947 235,164 242,618 251,297 262,602 294,725 311,196 304,203 296,749 303,944 311,205 HK$ HK$ HK$ HK$ HK$ HK$ HK$ HK$ HK$ HK$ Earnings per share 2.14 1.63 2.41 2.57 5.80 4.90 2.29 0.61 1.22 1.36 Dividends per share 0.60 0.66 0.71 0.71 0.77 0.84 0.88 0.91 0.95 1.00 Equity attributable to shareholders per share 34.59 35.50 36.97 38.52 44.00 47.74 49.05 49.27 49.85 49.44 RATIOS Return on average equity attributable to the Company’s shareholders 6.3% 4.6% 6.6% 6.8% 14.1% 10.7% 4.7% 1.2% 2.5% 2.7% Gearing ratio 15.8% 16.3% 15.3% 15.6% 13.6% 10.6% 5.3% 2.3% 3.5% 6.5% Interest cover – times 10.02 8.96 13.56 15.48 38.81 33.29 28.85 12.93 20.78 48.26 Dividend payout ratio 28.0% 40.6% 29.5% 27.6% 13.3% 17.1% 38.4% 148.6% 78.1% 73.3% UNDERLYING Profit (HK$M) 6,348 7,152 7,078 7,112 7,834 10,148 24,130 12,166 9,532 8,706 Return on average equity attributable to the Company’s shareholders 3.2% 3.5% 3.3% 3.2% 3.2% 3.8% 8.5% 4.2% 3.3% 3.0% Earnings per share (HK$) 1.09 1.22 1.21 1.22 1.34 1.73 4.12 2.08 1.63 1.49 Interest cover – times 6.43 7.58 7.75 8.89 10.68 12.58 48.16 32.10 32.96 74.74 Dividend payout ratio 55.3% 54.0% 58.7% 58.4% 57.5% 48.4% 21.3% 43.8% 58.3% 67.2% Notes: 1. The information for all years is shown in accordance with the Group’s current accounting policies and disclosure practices. Consequently figures for years prior to 2022 may be different from those originally presented. 2. The equity attributable to the Company’s shareholders and the returns by segment for 2022 and 2021 are shown in the Financial Review – Investment Appraisal and Performance Review on page 80. 3. Underlying profit is discussed on pages 33 to 35. 4. Refer to Glossary on page 215 for definitions and ratios. 17 SWIRE PROPERTIES ANNUAL REPORT 2022
 2022 Annual Report Page 18 Page 20