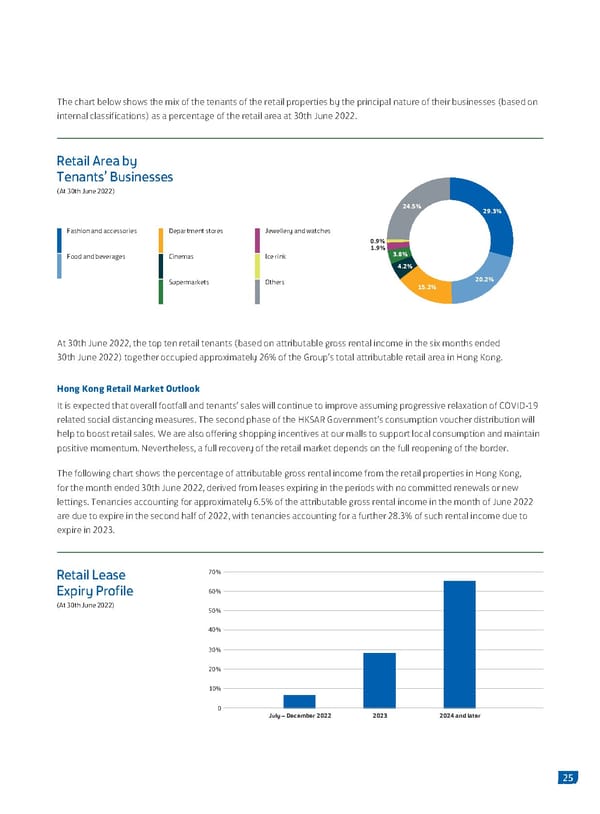
The chart below shows the mix of the tenants of the retail properties by the principal nature of their businesses (based on internal classifications) as a percentage of the retail area at 30th June 2022. Retail Area by enants’ usinesses At th June 24.5% 29.3% Fashion and accessories Department stores Jewellery and watches 0.9% 1.9% 3.8% Food and beverages Cinemas Ice rink 4.2% Supermarkets Others 15.2% 20.2% At 30th June 2022, the top ten retail tenants (based on attributable gross rental income in the six months ended 30th June 2022) together occupied approximately 26% of the Group’s total attributable retail area in Hong Kong. Hong Kong Retail Market Outlook It is expected that overall footfall and tenants’ sales will continue to improve assuming progressive relaxation of COVID-19 related social distancing measures. The second phase of the HKSAR Government’s consumption voucher distribution will help to boost retail sales. We are also offering shopping incentives at our malls to support local consumption and maintain positive momentum. Nevertheless, a full recovery of the retail market depends on the full reopening of the border. The following chart shows the percentage of attributable gross rental income from the retail properties in Hong Kong, for the month ended 30th June 2022, derived from leases expiring in the periods with no committed renewals or new lettings. Tenancies accounting for approximately 6.5% of the attributable gross rental income in the month of June 2022 are due to expire in the second half of 2022, with tenancies accounting for a further 28.3% of such rental income due to expire in 2023. Retail Lease 70% Expiry Profile 60% (At 30th Jue 2022 50% 40% 30% 20% 10% 0 July – December 2022 2023 2024 and later 25
 2022 Interim Report | EN Page 26 Page 28