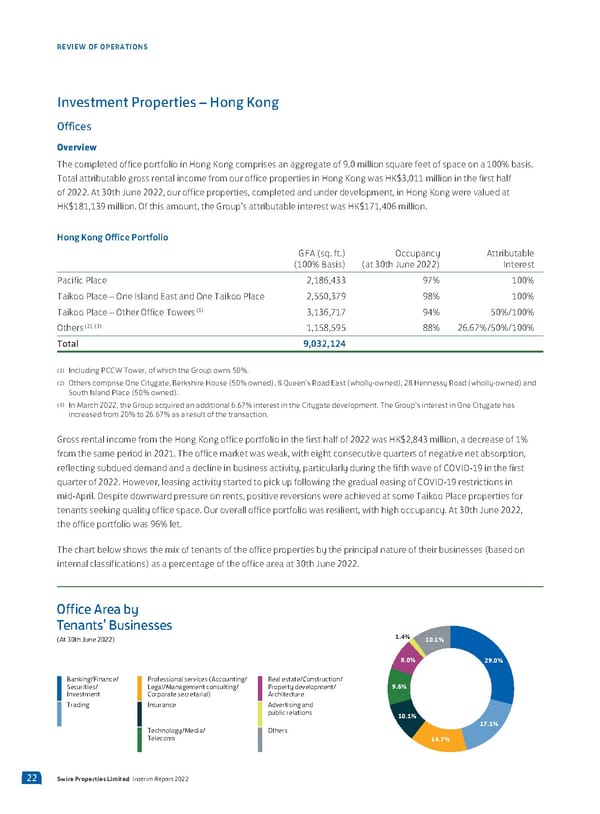
REVIEW OF OPERATIONS Investment Properties – Hong Kong Offices Overview The completed office portfolio in Hong Kong comprises an aggregate of 9.0 million square feet of space on a 100% basis. Total attributable gross rental income from our office properties in Hong Kong was HK$3,011 million in the first half of 2022. At 30th June 2022, our office properties, completed and under development, in Hong Kong were valued at HK$181,139 million. Of this amount, the Group’s attributable interest was HK$171,406 million. Hong Kong Office Portfolio GFA (sq. ft.) Occupancy Attributable (100% Basis) (at 30th June 2022) Interest Pacific Place 2,186,433 97% 100% Taikoo Place – One Island East and One Taikoo Place 2,550,379 98% 100% (1) Taikoo Place – Other Office Towers 3,136,717 94% 50%/100% (2), (3) Others 1,158,595 88% 26.67%/50%/100% Total 9,032,124 (1) Including PCCW Tower, of which the Group owns 50%. (2) Others comprise One Citygate, Berkshire House (50% owned), 8 Queen’s Road East (wholly-owned), 28 Hennessy Road (wholly-owned) and South Island Place (50% owned). (3) In March 2022, the Group acquired an additional 6.67% interest in the Citygate development. The Group’s interest in One Citygate has increased from 20% to 26.67% as a result of the transaction. Gross rental income from the Hong Kong office portfolio in the first half of 2022 was HK$2,843 million, a decrease of 1% from the same period in 2021. The office market was weak, with eight consecutive quarters of negative net absorption, reflecting subdued demand and a decline in business activity, particularly during the fifth wave of COVID-19 in the first quarter of 2022. However, leasing activity started to pick up following the gradual easing of COVID-19 restrictions in mid-April. Despite downward pressure on rents, positive reversions were achieved at some Taikoo Place properties for tenants seeking quality office space. Our overall office portfolio was resilient, with high occupancy. At 30th June 2022, the office portfolio was 96% let. The chart below shows the mix of tenants of the office properties by the principal nature of their businesses (based on internal classifications) as a percentage of the office area at 30th June 2022. ffice Area Tenants Businesses (At €t ‚une ƒ€ƒƒ 1.4% 10.1% 8.0% 29.0% Banking/Finance/ Professional services (Accounting/ eal estate/Construction/ Securities/ Legal/Management consulting/ Propert development/ 9.6% Investment Corporate secretarial Arcitecture Trading Insurance Advertising and pulic relations 10.1% Tecnolog/Media/ ters 17.1% Telecoms 14.7% 22 Swire Properties Limited Interim Report 2022
 2022 Interim Report | EN Page 23 Page 25