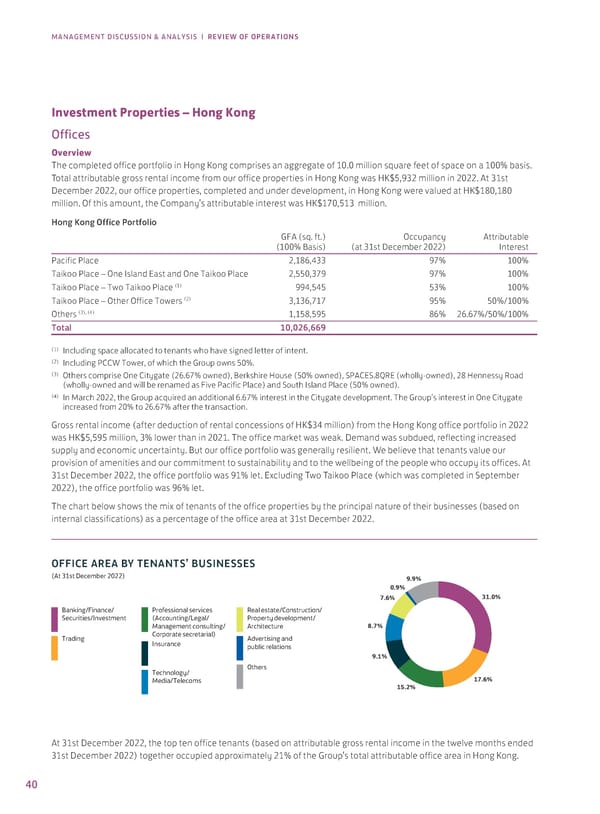
MANAGEMENT DISCUSSION & ANALYSIS | REVIEW OF OPERATIONS Investment Properties – Hong Kong Offices Overview The completed office portfolio in Hong Kong comprises an aggregate of 10.0 million square feet of space on a 100% basis. Total attributable gross rental income from our office properties in Hong Kong was HK$5,932 million in 2022. At 31st December 2022, our office properties, completed and under development, in Hong Kong were valued at HK$180,180 million. Of this amount, the Company’s attributable interest was HK$170,513 million. Hong Kong Office Portfolio GFA (sq. ft.) Occupancy Attributable (100% Basis) (at 31st December 2022) Interest Pacific Place 2,186,433 97% 100% Taikoo Place – One Island East and One Taikoo Place 2,550,379 97% 100% Taikoo Place – Two Taikoo Place (1) 994,545 53% 100% (2) Taikoo Place – Other Office Towers 3,136,717 95% 50%/100% Others (3), (4) 1,158,595 86% 26.67%/50%/100% Total 10,026,669 (1) Including space allocated to tenants who have signed letter of intent. (2) Including PCCW Tower, of which the Group owns 50%. (3) Others comprise One Citygate (26.67% owned), Berkshire House (50% owned), SPACES.8QRE (wholly-owned), 28 Hennessy Road (wholly-owned and will be renamed as Five Pacific Place) and South Island Place (50% owned). (4) In March 2022, the Group acquired an additional 6.67% interest in the Citygate development. The Group’s interest in One Citygate increased from 20% to 26.67% after the transaction. Gross rental income (after deduction of rental concessions of HK$34 million) from the Hong Kong office portfolio in 2022 was HK$5,595 million, 3% lower than in 2021. The office market was weak. Demand was subdued, reflecting increased supply and economic uncertainty. But our office portfolio was generally resilient. We believe that tenants value our provision of amenities and our commitment to sustainability and to the wellbeing of the people who occupy its offices. At 31st December 2022, the office portfolio was 91% let. Excluding Two Taikoo Place (which was completed in September 2022), the office portfolio was 96% let. The chart below shows the mix of tenants of the office properties by the principal nature of their businesses (based on internal classifications) as a percentage of the office area at 31st December 2022. OFFICE AREA BY TENANTS’ BUSINESSES (At st €ecemer ‚ƒ‚‚ 9.9% 0.9% 7.6% 31.0% Banking/Finance/ Professional services eal estate/Construction/ Securities/Investment (Accounting/Legal/ Propert development/ Management consulting/ Arcitecture 8.7% Trading Corporate secretarial Advertising and Insurance pulic relations 9.1% Tecnolog/ ters Media/Telecoms 17.6% 15.2% At 31st December 2022, the top ten office tenants (based on attributable gross rental income in the twelve months ended 31st December 2022) together occupied approximately 21% of the Group’s total attributable office area in Hong Kong. 40
 Annual Report 2022 Page 41 Page 43