
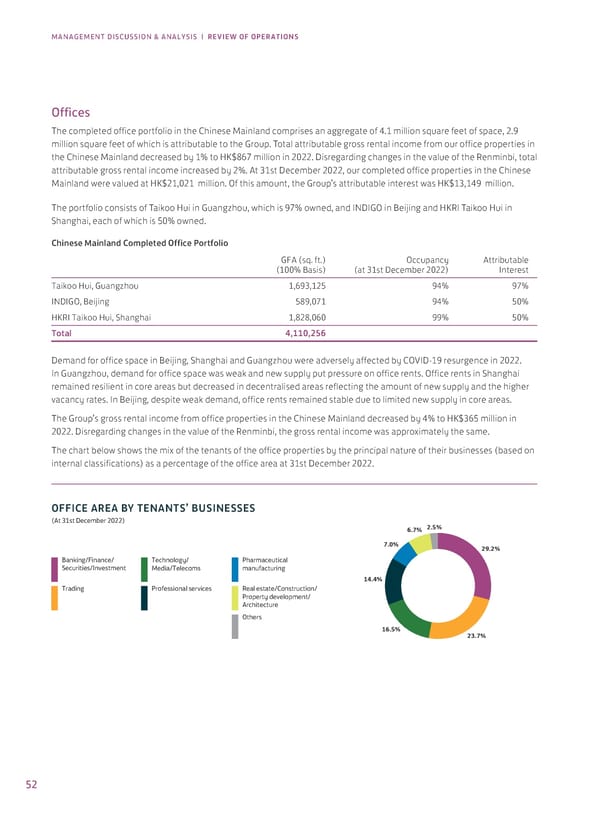
MANAGEMENT DISCUSSION & ANALYSIS | REVIEW OF OPERATIONS Offices The completed office portfolio in the Chinese Mainland comprises an aggregate of 4.1 million square feet of space, 2.9 million square feet of which is attributable to the Group. Total attributable gross rental income from our office properties in the Chinese Mainland decreased by 1% to HK$867 million in 2022. Disregarding changes in the value of the Renminbi, total attributable gross rental income increased by 2%. At 31st December 2022, our completed office properties in the Chinese Mainland were valued at HK$21,021 million. Of this amount, the Group’s attributable interest was HK$13,149 million. The portfolio consists of Taikoo Hui in Guangzhou, which is 97% owned, and INDIGO in Beijing and HKRI Taikoo Hui in Shanghai, each of which is 50% owned. Chinese Mainland Completed Office Portfolio GFA (sq. ft.) Occupancy Attributable (100% Basis) (at 31st December 2022) Interest Taikoo Hui, Guangzhou 1,693,125 94% 97% INDIGO, Beijing 589,071 94% 50% HKRI Taikoo Hui, Shanghai 1,828,060 99% 50% Total 4,110,256 Demand for office space in Beijing, Shanghai and Guangzhou were adversely affected by COVID-19 resurgence in 2022. In Guangzhou, demand for office space was weak and new supply put pressure on office rents. Office rents in Shanghai remained resilient in core areas but decreased in decentralised areas reflecting the amount of new supply and the higher vacancy rates. In Beijing, despite weak demand, office rents remained stable due to limited new supply in core areas. The Group’s gross rental income from office properties in the Chinese Mainland decreased by 4% to HK$365 million in 2022. Disregarding changes in the value of the Renminbi, the gross rental income was approximately the same. The chart below shows the mix of the tenants of the office properties by the principal nature of their businesses (based on internal classifications) as a percentage of the office area at 31st December 2022. OFFICE AREA BY TENANTS’ BUSINESSES t st ecem er €‚ 2.5% 6.7% 7.0% 29.2% Banking/Finance/ Technology/ Pharmaceutical Securities/Investment Media/Telecoms manufacturing 14.4% Trading Professional services Real estate/Construction/ Property development/ rchitecture thers 16.5% 23.7% 52
 Annual Report 2022 Page 53 Page 55