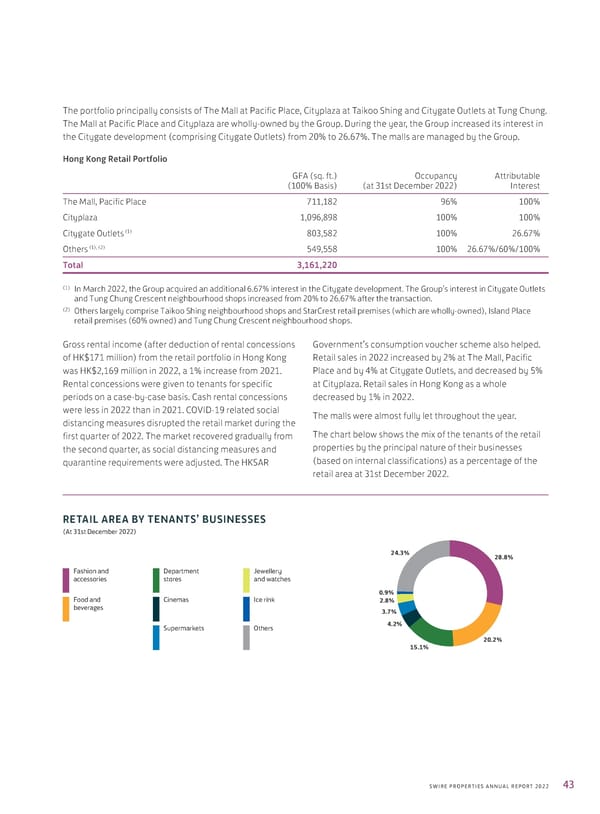
The portfolio principally consists of The Mall at Pacific Place, Cityplaza at Taikoo Shing and Citygate Outlets at Tung Chung. The Mall at Pacific Place and Cityplaza are wholly-owned by the Group. During the year, the Group increased its interest in the Citygate development (comprising Citygate Outlets) from 20% to 26.67%. The malls are managed by the Group. Hong Kong Retail Portfolio GFA (sq. ft.) Occupancy Attributable (100% Basis) (at 31st December 2022) Interest The Mall, Pacific Place 711,182 96% 100% Cityplaza 1,096,898 100% 100% Citygate Outlets (1) 803,582 100% 26.67% (1), (2) Others 549,558 100% 26.67%/60%/100% Total 3,161,220 (1) In March 2022, the Group acquired an additional 6.67% interest in the Citygate development. The Group’s interest in Citygate Outlets and Tung Chung Crescent neighbourhood shops increased from 20% to 26.67% after the transaction. (2) Others largely comprise Taikoo Shing neighbourhood shops and StarCrest retail premises (which are wholly-owned), Island Place retail premises (60% owned) and Tung Chung Crescent neighbourhood shops. Gross rental income (after deduction of rental concessions Government’s consumption voucher scheme also helped. of HK$171 million) from the retail portfolio in Hong Kong Retail sales in 2022 increased by 2% at The Mall, Pacific was HK$2,169 million in 2022, a 1% increase from 2021. Place and by 4% at Citygate Outlets, and decreased by 5% Rental concessions were given to tenants for specific at Cityplaza. Retail sales in Hong Kong as a whole periods on a case-by-case basis. Cash rental concessions decreased by 1% in 2022. were less in 2022 than in 2021. COVID-19 related social The malls were almost fully let throughout the year. distancing measures disrupted the retail market during the first quarter of 2022. The market recovered gradually from The chart below shows the mix of the tenants of the retail the second quarter, as social distancing measures and properties by the principal nature of their businesses quarantine requirements were adjusted. The HKSAR (based on internal classifications) as a percentage of the retail area at 31st December 2022. RETAIL AREA BY TENANTS’ BUSINESSES (At st December 24.3% 28.8% Fashion and Department Jewellery accessories stores and watches Food and Cinemas Ice rink 0.9% beverages 2.8% 3.7% Supermarkets Others 4.2% 20.2% 15.1% SWIRE PROPERTIES ANNUAL REPORT 2022 43
 Annual Report 2022 Page 44 Page 46