
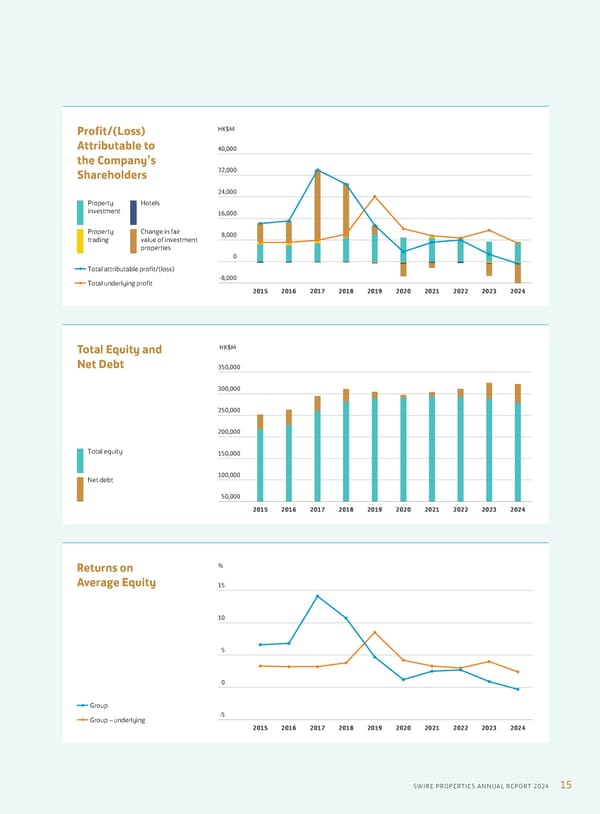
350,000 300,000 250,000 200,000 100,000 150,000 50,000 2015 2016 2017 2018 2019 2020 2021 2023 2022 2024 HK$M Total Equity and Net Debt Total equity Net debt 10 15 5 0 -5 2015 2016 2017 2018 2019 2020 2021 2023 2022 2024 % Returns on Average Equity Group Group – underlying 32,000 40,000 24,000 16,000 8,000 0 -8,000 2015 2016 2017 2018 2019 2020 2021 2023 2022 2024 HK$M Property investment Property trading Hotels Change in fair value of investment properties Total attributable profit/(loss) Total underlying profit Profit/(Loss) Attributable to the Company’s Shareholders 15 SWIRE PROPERTIES ANNUAL REPORT 2024
 Annual Report 2024 | EN Page 16 Page 18