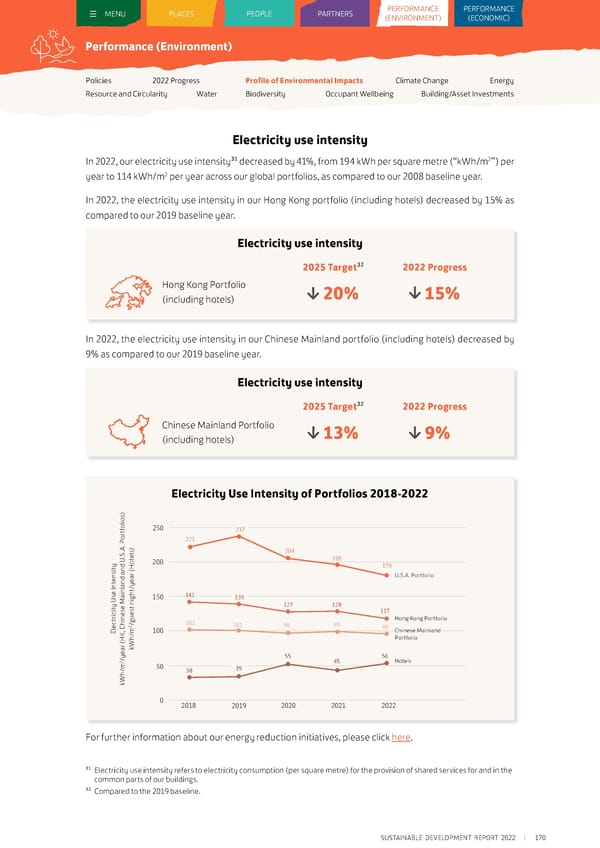
MENU PLACES PEOPLE PARTNERS PEPERRFOFORRMMAANNCCEE PERFORMANCE ((ENENVVIIRROONNMENMENTT)) (ECONOMIC) Performance (Environment) Policies 2022 Progress Profile of Environmental Impacts Climate Change Energy Resource and Circularity Water Biodiversity Occupant Wellbeing Building/Asset Investments Electricity use intensity 2 In 2022, our electricity use intensity³1 decreased by 41%, from 194 kWh per square metre (“kWh/m ”) per 2 year to 114 kWh/m per year across our global portfolios, as compared to our 2008 baseline year. In 2022, the electricity use intensity in our Hong Kong portfolio (including hotels) decreased by 15% as compared to our 2019 baseline year. Electricity use intensity 2025 Target³2 2022 Progress Hong Kong Portfolio 20% 15% (including hotels) In 2022, the electricity use intensity in our Chinese Mainland portfolio (including hotels) decreased by 9% as compared to our 2019 baseline year. Electricity use intensity 2025 Target³2 2022 Progress Chinese Mainland Portfolio 13% 9% (including hotels) Electricity Use Intensity of Portfolios 2018-2022 ) s o i l o 250 f 237 t r o 221 . P ) A . s 204 S . el 195 t 200 y d U o 179 it n H s ( U.S.A. Portfolio n d a e n ear nt a y I l / n t e i h 142 s a g 150 139 U i y n 127 128 it e M t c s es 117 e u tri n Hong Kong Portfolio c i g 102 e h 2/ 101 96 99 95 l , C m 100 Chinese Mainland E K Portfolio H h/ r ( kW a e 55 56 y 2/ 45 Hotels m 50 38 39 h/ kW 0 2018 2019 2020 2021 2022 For further information about our energy reduction initiatives, please click here. ³1 Electricity use intensity refers to electricity consumption (per square metre) for the provision of shared services for and in the common parts of our buildings. ³2 Compared to the 2019 baseline. SUSTAINABLE DEVELOPMENT REPORT 2022 170
 Sustainable Development Report 2022 Page 170 Page 172