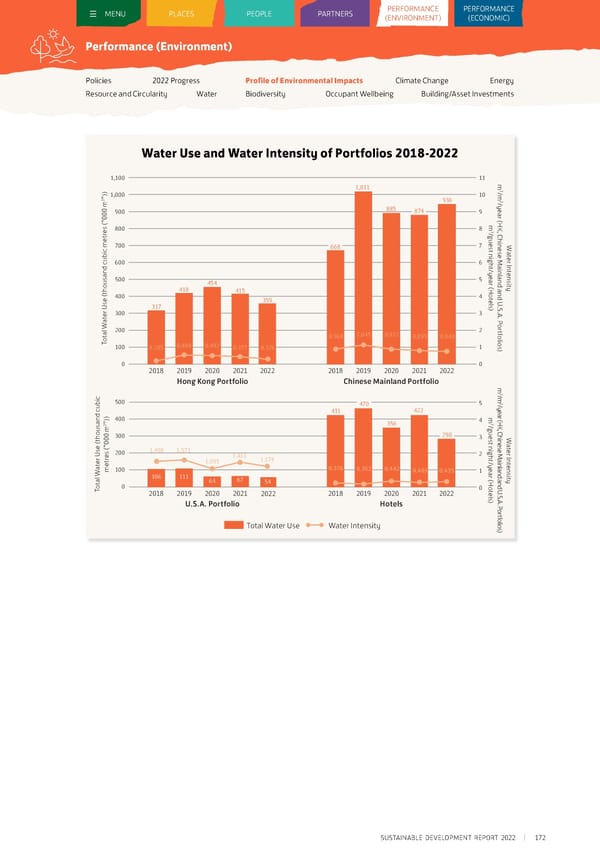
MENU PLACES PEOPLE PARTNERS PEPERRFOFORRMMAANNCCEE PERFORMANCE ((ENENVVIIRROONNMENMENTT)) (ECONOMIC) Performance (Environment) Policies 2022 Progress Profile of Environmental Impacts Climate Change Energy Resource and Circularity Water Biodiversity Occupant Wellbeing Building/Asset Investments Water Use and Water Intensity of Portfolios 2018-2022 1,100 11 1,011 m /3 )) m ” 1,000 10 3 936 /2 y 0 m 885 874 e 0 900 9 a 0 r ( “ m H s ( 800 8 3 K e / , C r t g h e u i 700 7 es n W 668 t e a c m n s i e M t b i e u g r 600 6 h a In t i d c / n t n y l e a ear a nsi s 500 5 n u 454 ( d a t o 418 H y h t 415 o n 400 4 t d U e ( 359 el s s . 317 ) S r U . e 300 3 A t . P a o r l W 200 2 t a f t 0.968 1.045 0.912 0.899 0.840 o l o i T o 100 0.408 0.402 1 s 0.285 0.377 0.326 ) 0 2018 2019 2020 2021 2022 2018 2019 2020 2021 2022 0 Hong Kong Portfolio Chinese Mainland Portfolio m3 / c m i b 500 470 5 /2 u y 431 422 e d c a n )) 400 m r ( a 3” 356 4 /3 H s g K u u , C o 0 m300 290 3 es h W h i t 0 t n 0 n e a e ( “ s t i e M e s s (200 1.498 1.571 g r e 1.461 2 h a In r U r 1.174 t t 1.095 / i t e y n e t e l a 0.376 0.352 0.442 ear a nsi m 100 0.403 0.435 1 n l W 106 111 ( d a t a 64 67 H n y t 0 54 o d U o 0 T t el . 2018 2019 2020 2021 2022 2018 2019 2020 2021 2022 s S . ) A U.S.A. Portfolio Hotels . P o r t f o l i o Total Water Use Water Intensity s ) SUSTAINABLE DEVELOPMENT REPORT 2022 172
 Sustainable Development Report 2022 Page 172 Page 174