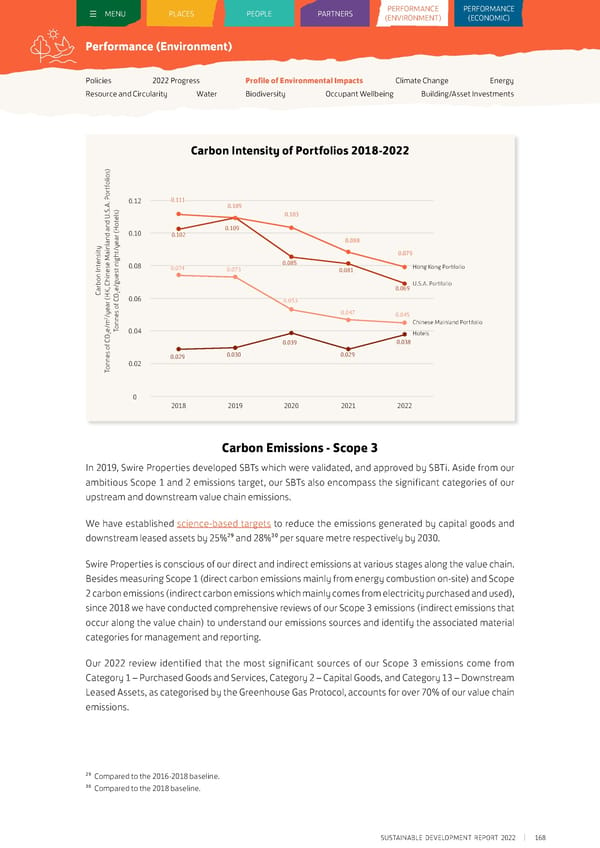
MENU PLACES PEOPLE PARTNERS PEPERRFOFORRMMAANNCCEE PERFORMANCE ((ENENVVIIRROONNMENMENTT)) (ECONOMIC) Performance (Environment) Policies 2022 Progress Profile of Environmental Impacts Climate Change Energy Resource and Circularity Water Biodiversity Occupant Wellbeing Building/Asset Investments Carbon Intensity of Portfolios 2018-2022 ) s o i l o f t r o . P 0.12 0.111 A 0.109 . ) S . s 0.103 el d U t n o 0.109 H d a ( 0.10 0.102 n 0.088 a ear l y y n / t i t nsi a h 0.079 g e e M i 0.085 t s n 0.08 0.074 Hong Kong Portfolio In e t 0.073 0.081 n n es o i u b h g U.S.A. Portfolio r , C / 0.069 a K e2 C H O 0.06 r ( f C 0.053 a e s o 0.047 y e 0.045 2/ n m n Chinese Mainland Portfolio / o e2 T 0.04 Hotels O 0.039 0.038 f C s o 0.030 0.029 e 0.029 n n 0.02 o T 0 2018 2019 2020 2021 2022 Carbon Emissions - Scope 3 In 2019, Swire Properties developed SBTs which were validated, and approved by SBTi. Aside from our ambitious Scope 1 and 2 emissions target, our SBTs also encompass the significant categories of our upstream and downstream value chain emissions. We have established science-based targets to reduce the emissions generated by capital goods and downstream leased assets by 25%29 and 28%³0 per square metre respectively by 2030. Swire Properties is conscious of our direct and indirect emissions at various stages along the value chain. Besides measuring Scope 1 (direct carbon emissions mainly from energy combustion on-site) and Scope 2 carbon emissions (indirect carbon emissions which mainly comes from electricity purchased and used), since 2018 we have conducted comprehensive reviews of our Scope 3 emissions (indirect emissions that occur along the value chain) to understand our emissions sources and identify the associated material categories for management and reporting. Our 2022 review identified that the most significant sources of our Scope 3 emissions come from Category 1 – Purchased Goods and Services, Category 2 – Capital Goods, and Category 13 – Downstream Leased Assets, as categorised by the Greenhouse Gas Protocol, accounts for over 70% of our value chain emissions. 29 Compared to the 2016-2018 baseline. ³0 Compared to the 2018 baseline. SUSTAINABLE DEVELOPMENT REPORT 2022 168
 Sustainable Development Report 2022 Page 168 Page 170