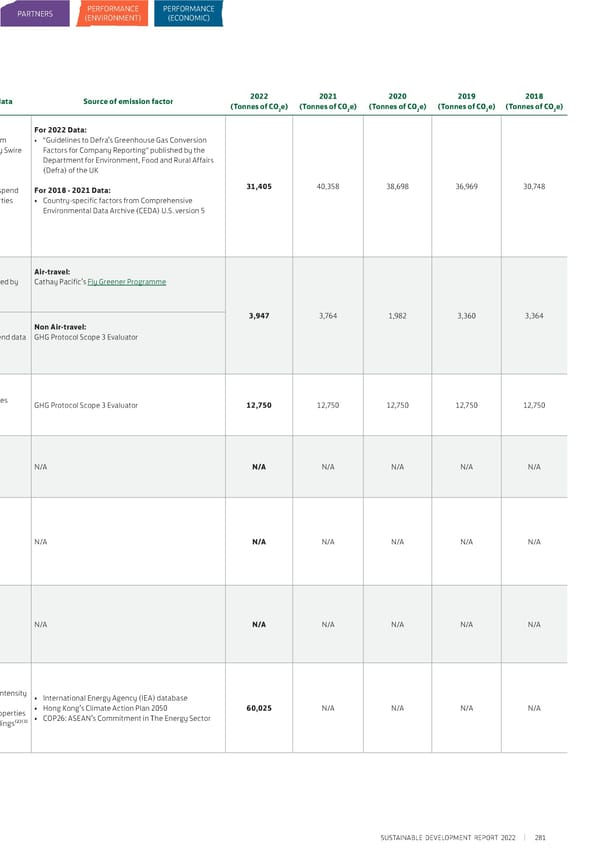
MENUPLACESPEOPLEPARTNERS PERFORMANCE PERFORMANCE (ENVIRONMENT) (ECONOMIC) Carbon Emissions - Scope 3 Emissions Inventory and Reporting Methodology Scope 3 categoryDescriptionApplicabilityMethodology(1) / Justification for exclusionSource of activity data Source of emission factor2022 2021 2020 2019 2018 (Tonnes of CO e) (Tonnes of CO e) (Tonnes of CO e) (Tonnes of CO e) (Tonnes of CO e) 2 2 2 2 2 For 2022 Data: For 2022 Data: For 2022 Data: Waste data is multiplied by corresponding emission • Primary waste data from • “Guidelines to Defra’s Greenhouse Gas Conversion factors to calculate emissions in this category. properties managed by Swire Factors for Company Reporting” published by the Properties Department for Environment, Food and Rural Affairs For 2018 - 2021 Data: (Defra) of the UK Waste generated in Emissions from disposal and The primary spend data related to waste management For 2018 - 2021 Data: 5operations treatment of waste generated by Yes services are multiplied by the corresponding Scope 3 GHG • Primary procurement spend For 2018 - 2021 Data:31,40540,358 38,698 36,969 30,748 Swire Properties emission data associated with average waste treatment data from Swire Properties• Country-specific factors from Comprehensive services in the U.S.A. to calculate emissions in this Environmental Data Archive (CEDA) U.S. version 5 category. Air-travel:Air-travel:Air-travel: Flight distance is multiplied by corresponding emission Travel related data provided by Cathay Pacific’s Fly Greener Programme factors to calculate emissions in this category.travel providers Emissions from transportation of Swire Properties’ employees 6Business travelfor business-related activities (in Yes 3,947 3,764 1,982 3,360 3,364 vehicles not owned or operated Non Air-travel: Non Air-travel: Non Air-travel: by Swire Properties)Emissions in this category are derived from the amount Primary procurement spend data GHG Protocol Scope 3 Evaluator Swire Properties’ employee spend on “automobile” and from Swire Properties “hotel room”. Emissions from transportation of Emissions in this category are derived from Swire Number of Swire Properties 7Employee commuting employees between their homes Yes Properties’ number of employees.employeesGHG Protocol Scope 3 Evaluator12,750 12,750 12,750 12,750 12,750 and worksites As a real estate developer, Swire Properties develops 8Upstream leased assets Emissions from operation of Noand manages properties which are leased to customers. N/AN/A N/A N/A N/A N/A N/A assets leased by Swire Properties The emissions of leased offices are identified as Scope 2 emissions. Emissions from transportation As a real estate developer, Swire Properties develops and Downstream and distribution of products sold manages properties which are leased to customers. There 9transportation and between Swire Properties and Noare no manufactured products and hence no emissions to N/AN/A N/A N/A N/A N/A N/A distributionthe end consumer, including report under this category. retail and storage Emissions from processing of As a real estate developer, Swire Properties develops and 10Processing of sold intermediate products sold by Nomanages properties which are leased to customers. There N/AN/A N/A N/A N/A N/A N/A productsdownstream companies such as are no manufactured products and hence no emissions to manufacturersreport under this category. Operational carbon emissions The design electricity use intensity of the residential • Design electricity use intensity from the entire use stage buildings and their projected future change, is multiplied of residential buildings • International Energy Agency (IEA) database 11Use of sold productsof trading properties (e.g. Yesby corresponding projected emission factors of the entire developed by Swire Properties• Hong Kong’s Climate Action Plan 205060,025N/A N/A N/A N/A residential buildings) developed use stage to calculate emissions in this category(2)(³). • GFA of residential buildings(2)(³)• COP26: ASEAN’s Commitment in The Energy Sector by Swire Properties SUSTAINABLE DEVELOPMENT REPORT 2022 281
 Sustainable Development Report 2022 Page 285 Page 287