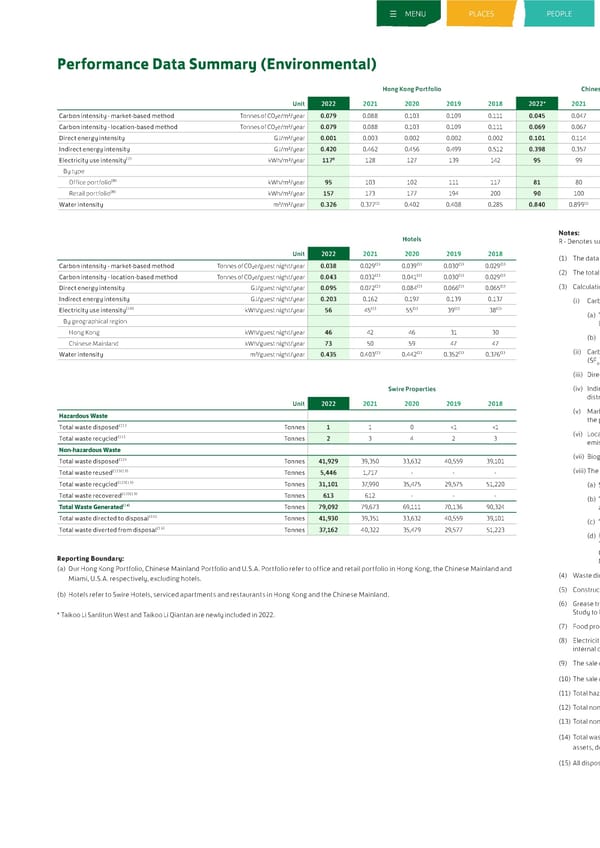
MENU PLACES PEOPLE PARTNERS PERFORMANCE PERFORMANCE (ENVIRONMENT) (ECONOMIC) Performance Data Summary (Environmental) Hong Kong Portfolio Chinese Mainland Portfolio U.S.A. Portfolio Hong Kong, Chinese Mainland and U.S.A. Portfolios Total Unit 2022 2021 2020 2019 2018 2022* 2021 2020 2019 2018 2022 2021 2020 2019 2018 2022 2021 2020 2019 2018 Carbon intensity - market-based method Tonnes of CO2e/m2/year 0.079 0.088 0.103 0.109 0.111 0.045 0.047 0.053 0.073 0.074 0.069 0.081 0.085 0.109 0.102 0.062 0.069 0.080 0.092 0.097 Carbon intensity - location-based method Tonnes of CO2e/m2/year 0.079 0.088 0.103 0.109 0.111 0.069 0.067 0.064 0.073 0.074 0.069 0.081 0.085 0.109 0.102 0.074 0.078 0.085 0.092 0.097 Direct energy intensity GJ/m2/year 0.001 0.003 0.002 0.002 0.002 0.101 0.114 0.097 0.117 0.128 0.005 0.005 0.008 0.010 0.011 0.050 0.054 0.045 0.056 0.049 Indirect energy intensity GJ/m2/year 0.420 0.462 0.456 0.499 0.512 0.398 0.357 0.344 0.363 0.365 0.643 0.704 0.736 0.854 0.795 0.414 0.419 0.413 0.447 0.468 R Electricity use intensity(2) kWh/m2/year 117 128 127 139 142 95 99 96 101 102 179 195 204 237 221 107 117 115 124 130 By type Office portfolio(8) kWh/m2/year 95 103 102 111 117 81 80 76 77 80 N/A(9) N/A(9) 192 234 218 91 96 95 103 112 Retail portfolio(8) kWh/m2/year 157 173 177 194 200 90 100 95 105 102 179 195 208 239 222 111 126 123 135 138 (1) (1) (1) Water intensity m3/m2/year 0.326 0.377 0.402 0.408 0.285 0.840 0.899 0.912 1.045 0.968 1.174 1.461 1.095 1.571 1.498 0.597 0.640 0.650 0.747 0.582 Notes: Hotels R - Denotes sustainability data that has been reported on by Deloitte Touche Tohmatsu. Please refer to the Independent Limited Assurance Report for further details. Unit 2022 2021 2020 2019 2018 (1) The data has been adjusted to reflect actual situation. Carbon intensity - market-based method Tonnes of CO2e/guest night/year 0.038 0.029(1) 0.039(1) 0.030(1) 0.029(1) Carbon intensity - location-based method Tonnes of CO2e/guest night/year 0.043 0.032(1) 0.041(1) 0.030(1) 0.029(1) (2) The total energy consumption refers to energy consumption for the provision of shared services for and in the common parts of our buildings. Direct energy intensity GJ/guest night/year 0.095 0.072(1) 0.084(1) 0.066(1) 0.065(1) (3) Calculation standards and methodologies for carbon emissions: Indirect energy intensity GJ/guest night/year 0.203 0.162 0.197 0.139 0.137 (i) Carbon emissions are calculated using: Electricity use intensity(10) kWh/guest night/year 56 45(1) 55(1) 39(1) 38(1) (a) “Guidelines to Account for and Report on Greenhouse Gas Emissions and Removals for Buildings (Commercial, Residential or Institutional Purposes) in Hong Kong” published by the By geographical region Environmental Protection Department (EPD) and the Electrical and Mechanical Services Department (EMSD) of the Hong Kong Government. Hong Kong kWh/guest night/year 46 42 46 31 30 (b) GHG Protocol published by the WBCSD and the World Resources Institute. Chinese Mainland kWh/guest night/year 73 50 59 47 47 (ii) Carbon dioxide (CO ), methane (CH ), nitrous oxide (N O) and hydrofluorocarbons (HFCs) are included in greenhouse gas (GHG) calculations. Perfluorocarbons (PFCs), sulphur hexafluoride Water intensity m3/guest night/year 0.435 0.403(1) 0.442(1) 0.352(1) 0.376(1) 2 4 2 (SF ) and nitrogen trifluoride (NF ) are not applicable. 6 3 (iii) Direct carbon emissions included industrial diesel, ULSD, biodiesel (for CH4 and N2O emissions), petrol, town gas, natural gas and refrigerant containing HFCs refilled. Swire Properties (iv) Indirect carbon emissions included non-renewable electricity purchased, off-site renewable electricity purchased (via power purchase agreement), on-site renewable electricity generated, district heating and cooling (energy purchased from local utility companies) and town gas. Unit 2022 2021 2020 2019 2018 Hazardous Waste (v) Market-based method for indirect carbon emissions (as defined by GHG Protocol Scope 2 Guidance) refers to a method to quantify scope 2 emissions based on GHG emissions emitted by the generators from which the reporter contractually purchases electricity bundled with instruments, or unbundled instruments on their own. Total waste disposed(11) Tonnes 1 1 0
 Sustainable Development Report 2022 Page 280 Page 282