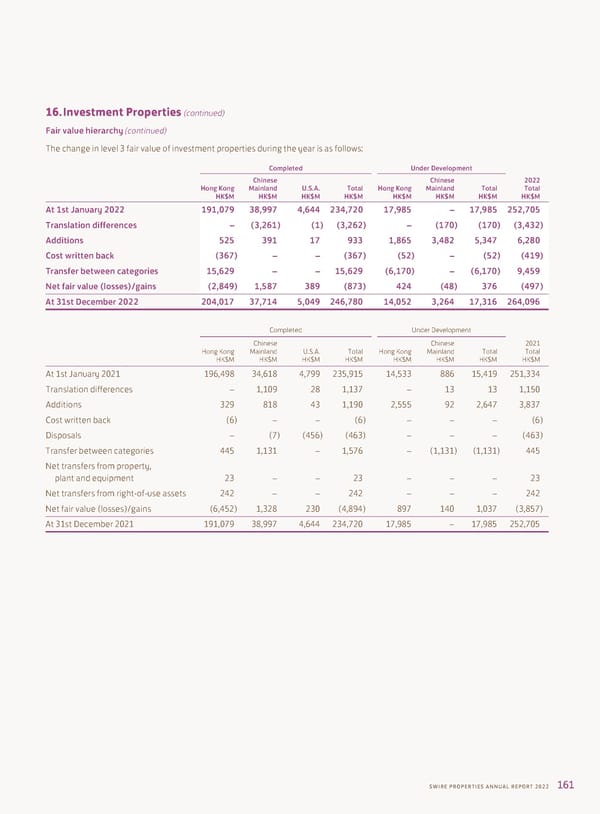
16. Investment Properties (continued) Fair value hierarchy (continued) The change in level 3 fair value of investment properties during the year is as follows: Completed Under Development Chinese Chinese 2022 Hong Kong Mainland U.S.A. Total Hong Kong Mainland Total Total HK$M HK$M HK$M HK$M HK$M HK$M HK$M HK$M At 1st January 2022 191,079 38,997 4,644 234,720 17,985 – 17,985 252,705 Translation differences – (3,261) (1) (3,262) – (170) (170) (3,432) Additions 525 391 17 933 1,865 3,482 5,347 6,280 Cost written back (367) – – (367) (52) – (52) (419) Transfer between categories 15,629 – – 15,629 (6,170) – (6,170) 9,459 Net fair value (losses)/gains (2,849) 1,587 389 (873) 424 (48) 376 (497) At 31st December 2022 204,017 37,714 5,049 246,780 14,052 3,264 17,316 264,096 Completed Under Development Chinese Chinese 2021 Hong Kong Mainland U.S.A. Total Hong Kong Mainland Total Total HK$M HK$M HK$M HK$M HK$M HK$M HK$M HK$M At 1st January 2021 196,498 34,618 4,799 235,915 14,533 886 15,419 251,334 Translation differences – 1,109 28 1,137 – 13 13 1,150 Additions 329 818 43 1,190 2,555 92 2,647 3,837 Cost written back (6) – – (6) – – – (6) Disposals – (7) (456) (463) – – – (463) Transfer between categories 445 1,131 – 1,576 – (1,131) (1,131) 445 Net transfers from property, plant and equipment 23 – – 23 – – – 23 Net transfers from right-of-use assets 242 – – 242 – – – 242 Net fair value (losses)/gains (6,452) 1,328 230 (4,894) 897 140 1,037 (3,857) At 31st December 2021 191,079 38,997 4,644 234,720 17,985 – 17,985 252,705 SWIRE PROPERTIES ANNUAL REPORT 2022 161
 2022 Annual Report Page 162 Page 164