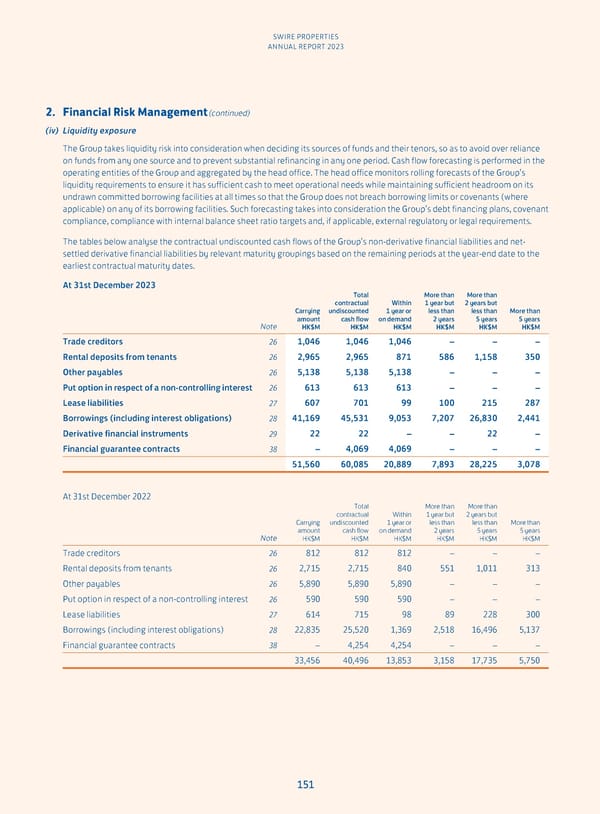
SWIRE PROPERTIES ANNUAL REPORT 2023 2. Financial Risk Management (continued) (iv) Liquidity exposure The Group takes liquidity risk into consideration when deciding its sources of funds and their tenors, so as to avoid over reliance on funds from any one source and to prevent substantial refinancing in any one period. Cash flow forecasting is performed in the operating entities of the Group and aggregated by the head office. The head office monitors rolling forecasts of the Group’s liquidity requirements to ensure it has sufficient cash to meet operational needs while maintaining sufficient headroom on its undrawn committed borrowing facilities at all times so that the Group does not breach borrowing limits or covenants (where applicable) on any of its borrowing facilities. Such forecasting takes into consideration the Group’s debt financing plans, covenant compliance, compliance with internal balance sheet ratio targets and, if applicable, external regulatory or legal requirements. The tables below analyse the contractual undiscounted cash flows of the Group’s non-derivative financial liabilities and net- settled derivative financial liabilities by relevant maturity groupings based on the remaining periods at the year-end date to the earliest contractual maturity dates. At 31st December 2023 Total More than More than contractual Within 1 year but 2 years but Carrying undiscounted 1 year or less than less than More than Note amount cash flow on demand 2 years 5 years 5 years HK$M HK$M HK$M HK$M HK$M HK$M Trade creditors 26 1,046 1,046 1,046 – – – Rental deposits from tenants 26 2,965 2,965 871 586 1,158 350 Other payables 26 5,138 5,138 5,138 – – – Put option in respect of a non-controlling interest 26 613 613 613 – – – Lease liabilities 27 607 701 99 100 215 287 Borrowings (including interest obligations) 28 41,169 45,531 9,053 7,207 26,830 2,441 Derivative financial instruments 29 22 22 – – 22 – Financial guarantee contracts 38 – 4,069 4,069 – – – 51,560 60,085 20,889 7,893 28,225 3,078 At 31st December 2022 Total More than More than contractual Within 1 year but 2 years but Carrying undiscounted 1 year or less than less than More than Note amount cash flow on demand 2 years 5 years 5 years HK$M HK$M HK$M HK$M HK$M HK$M Trade creditors 26 812 812 812 – – – Rental deposits from tenants 26 2,715 2,715 840 551 1,011 313 Other payables 26 5,890 5,890 5,890 – – – Put option in respect of a non-controlling interest 26 590 590 590 – – – Lease liabilities 27 614 715 98 89 228 300 Borrowings (including interest obligations) 28 22,835 25,520 1,369 2,518 16,496 5,137 Financial guarantee contracts 38 – 4,254 4,254 – – – 33,456 40,496 13,853 3,158 17,735 5,750 151
 Annual Report 2023 Page 152 Page 154