
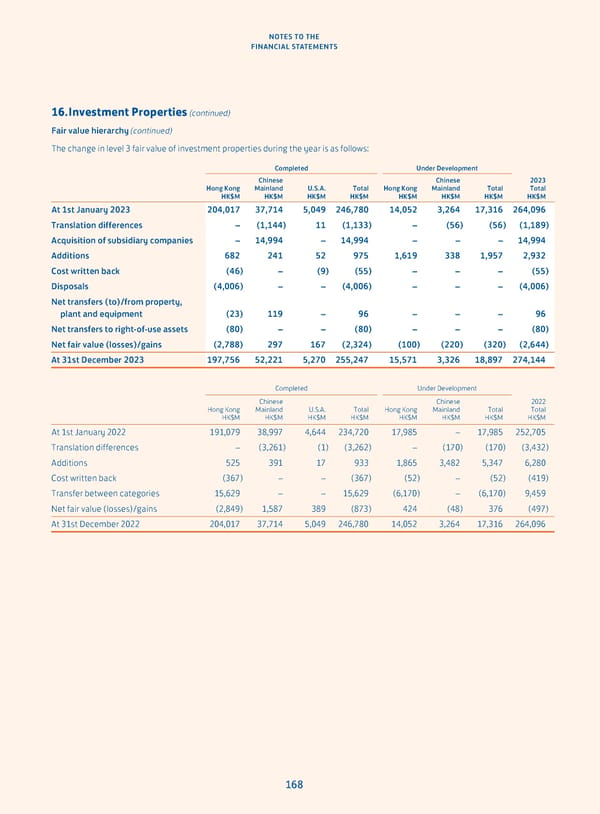
NOTES TO THE FINANCIAL STATEMENTS 16. Investment Properties (continued) Fair value hierarchy (continued) The change in level 3 fair value of investment properties during the year is as follows: Completed Under Development Chinese Chinese 2023 Hong Kong Mainland U.S.A. Total Hong Kong Mainland Total Total HK$M HK$M HK$M HK$M HK$M HK$M HK$M HK$M At 1st January 2023 204,017 37,714 5,049 246,780 14,052 3,264 17,316 264,096 Translation differences – (1,144) 11 (1,133) – (56) (56) (1,189) Acquisition of subsidiary companies – 14,994 – 14,994 – – – 14,994 Additions 682 241 52 975 1,619 338 1,957 2,932 Cost written back (46) – (9) (55) – – – (55) Disposals (4,006) – – (4,006) – – – (4,006) Net transfers (to)/from property, plant and equipment (23) 119 – 96 – – – 96 Net transfers to right-of-use assets (80) – – (80) – – – (80) Net fair value (losses)/gains (2,788) 297 167 (2,324) (100) (220) (320) (2,644) At 31st December 2023 197,756 52,221 5,270 255,247 15,571 3,326 18,897 274,144 Completed Under Development Chinese Chinese 2022 Hong Kong Mainland U.S.A. Total Hong Kong Mainland Total Total HK$M HK$M HK$M HK$M HK$M HK$M HK$M HK$M At 1st January 2022 191,079 38,997 4,644 234,720 17,985 – 17,985 252,705 Translation differences – (3,261) (1) (3,262) – (170) (170) (3,432) Additions 525 391 17 933 1,865 3,482 5,347 6,280 Cost written back (367) – – (367) (52) – (52) (419) Transfer between categories 15,629 – – 15,629 (6,170) – (6,170) 9,459 Net fair value (losses)/gains (2,849) 1,587 389 (873) 424 (48) 376 (497) At 31st December 2022 204,017 37,714 5,049 246,780 14,052 3,264 17,316 264,096 168
 Annual Report 2023 Page 169 Page 171