
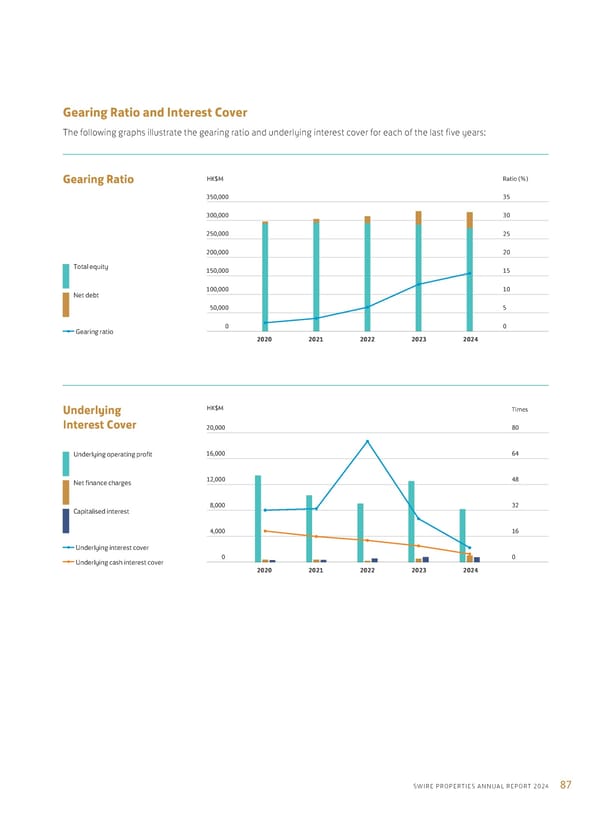
2023 2020 2021 2024 2022 300,000 200,000 250,000 350,000 150,000 100,000 50,000 0 35 20 25 30 15 10 5 0 Ratio (%) HK$M Gearing Ratio Total equity Net debt Gearing ratio 16,000 12,000 20,000 8,000 4,000 0 80 48 64 32 16 0 2023 2020 2021 2024 2022 Times HK$M Underlying Interest Cover Underlying operating profit Net finance charges Capitalised interest Underlying interest cover Underlying cash interest cover 87 SWIRE PROPERTIES ANNUAL REPORT 2024 Gearing Ratio and Interest Cover The following graphs illustrate the gearing ratio and underlying interest cover for each of the last five years:
 Annual Report 2024 | EN Page 88 Page 90