
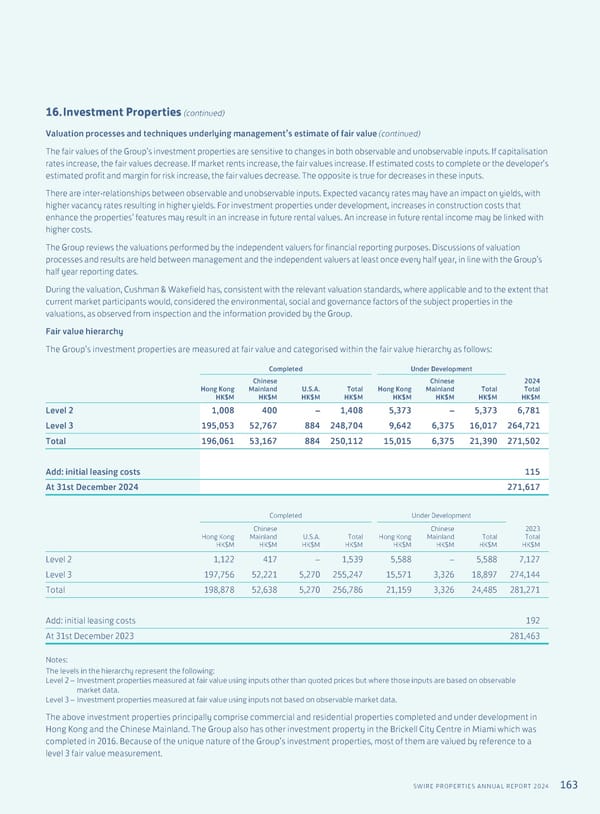
163 SWIRE PROPERTIES ANNUAL REPORT 2024 16. Investment Properties (continued) Valuation processes and techniques underlying management’s estimate of fair value (continued) The fair values of the Group’s investment properties are sensitive to changes in both observable and unobservable inputs. If capitalisation rates increase, the fair values decrease. If market rents increase, the fair values increase. If estimated costs to complete or the developer’s estimated profit and margin for risk increase, the fair values decrease. The opposite is true for decreases in these inputs. There are inter-relationships between observable and unobservable inputs. Expected vacancy rates may have an impact on yields, with higher vacancy rates resulting in higher yields. For investment properties under development, increases in construction costs that enhance the properties’ features may result in an increase in future rental values. An increase in future rental income may be linked with higher costs. The Group reviews the valuations performed by the independent valuers for financial reporting purposes. Discussions of valuation processes and results are held between management and the independent valuers at least once every half year, in line with the Group’s half year reporting dates. During the valuation, Cushman & Wakefield has, consistent with the relevant valuation standards, where applicable and to the extent that current market participants would, considered the environmental, social and governance factors of the subject properties in the valuations, as observed from inspection and the information provided by the Group. Fair value hierarchy The Group’s investment properties are measured at fair value and categorised within the fair value hierarchy as follows: Completed Under Development Hong Kong HK$M Chinese Mainland HK$M U.S.A. HK$M Total HK$M Hong Kong HK$M Chinese Mainland HK$M Total HK$M 2024 Total HK$M Level 2 1,008 400 – 1,408 5,373 – 5,373 6,781 Level 3 195,053 52,767 884 248,704 9,642 6,375 16,017 264,721 Total 196,061 53,167 884 250,112 15,015 6,375 21,390 271,502 Add: initial leasing costs 115 At 31st December 2024 271,617 Completed Under Development Hong Kong HK$M Chinese Mainland HK$M U.S.A. HK$M Total HK$M Hong Kong HK$M Chinese Mainland HK$M Total HK$M 2023 Total HK$M Level 2 1,122 417 – 1,539 5,588 – 5,588 7,127 Level 3 197,756 52,221 5,270 255,247 15,571 3,326 18,897 274,144 Total 198,878 52,638 5,270 256,786 21,159 3,326 24,485 281,271 Add: initial leasing costs 192 At 31st December 2023 281,463 Notes: The levels in the hierarchy represent the following: Level 2 – Investment properties measured at fair value using inputs other than quoted prices but where those inputs are based on observable market data. Level 3 – Investment properties measured at fair value using inputs not based on observable market data. The above investment properties principally comprise commercial and residential properties completed and under development in Hong Kong and the Chinese Mainland. The Group also has other investment property in the Brickell City Centre in Miami which was completed in 2016. Because of the unique nature of the Group’s investment properties, most of them are valued by reference to a level 3 fair value measurement.
 Annual Report 2024 | EN Page 164 Page 166