
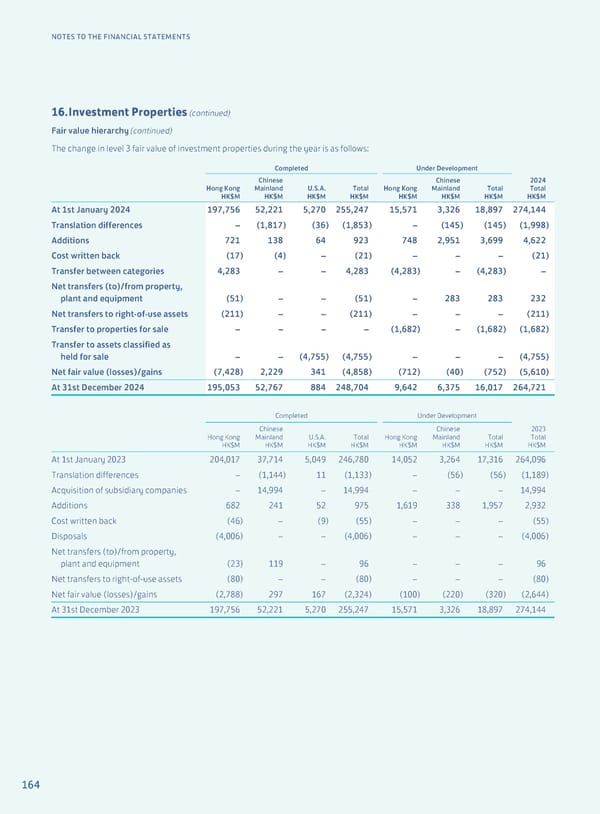
164 NOTES TO THE FINANCIAL STATEMENTS 16. Investment Properties (continued) Fair value hierarchy (continued) The change in level 3 fair value of investment properties during the year is as follows: Completed Under Development Hong Kong HK$M Chinese Mainland HK$M U.S.A. HK$M Total HK$M Hong Kong HK$M Chinese Mainland HK$M Total HK$M 2024 Total HK$M At 1st January 2024 197,756 52,221 5,270 255,247 15,571 3,326 18,897 274,144 Translation differences – (1,817) (36) (1,853) – (145) (145) (1,998) Additions 721 138 64 923 748 2,951 3,699 4,622 Cost written back (17) (4) – (21) – – – (21) Transfer between categories 4,283 – – 4,283 (4,283) – (4,283) – Net transfers (to)/from property, plant and equipment (51) – – (51) – 283 283 232 Net transfers to right-of-use assets (211) – – (211) – – – (211) Transfer to properties for sale – – – – (1,682) – (1,682) (1,682) Transfer to assets classified as held for sale – – (4,755) (4,755) – – – (4,755) Net fair value (losses)/gains (7,428) 2,229 341 (4,858) (712) (40) (752) (5,610) At 31st December 2024 195,053 52,767 884 248,704 9,642 6,375 16,017 264,721 Completed Under Development Hong Kong HK$M Chinese Mainland HK$M U.S.A. HK$M Total HK$M Hong Kong HK$M Chinese Mainland HK$M Total HK$M 2023 Total HK$M At 1st January 2023 204,017 37,714 5,049 246,780 14,052 3,264 17,316 264,096 Translation differences – (1,144) 11 (1,133) – (56) (56) (1,189) Acquisition of subsidiary companies – 14,994 – 14,994 – – – 14,994 Additions 682 241 52 975 1,619 338 1,957 2,932 Cost written back (46) – (9) (55) – – – (55) Disposals (4,006) – – (4,006) – – – (4,006) Net transfers (to)/from property, plant and equipment (23) 119 – 96 – – – 96 Net transfers to right-of-use assets (80) – – (80) – – – (80) Net fair value (losses)/gains (2,788) 297 167 (2,324) (100) (220) (320) (2,644) At 31st December 2023 197,756 52,221 5,270 255,247 15,571 3,326 18,897 274,144
 Annual Report 2024 | EN Page 165 Page 167