
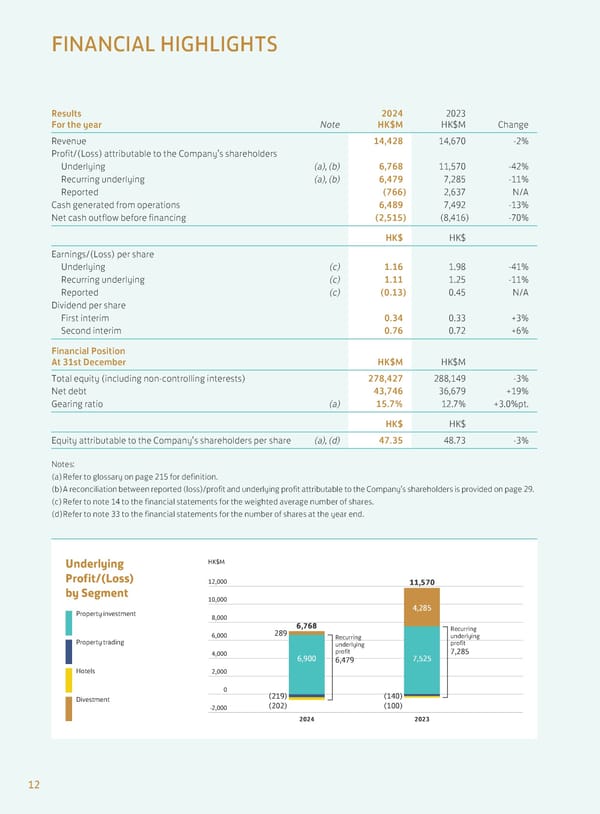
12,000 10,000 8,000 6,000 4,000 2,000 0 -2,000 2024 2023 (219) (202) 6,768 6,900 7,525 289 11,570 4,285 (140) (100) HK$M Property trading Recurring underlying profit 6,479 Recurring underlying profit 7,285 Hotels Property investment Divestment Underlying Profit/(Loss) by Segment 12 Results For the year Note 2024 HK$M 2023 HK$M Change Revenue 14,428 14,670 -2% Profit/(Loss) attributable to the Company’s shareholders Underlying (a), (b) 6,768 11,570 -42% Recurring underlying (a), (b) 6,479 7,285 -11% Reported (766) 2,637 N/A Cash generated from operations 6,489 7,492 -13% Net cash outflow before financing (2,515) (8,416) -70% HK$ HK$ Earnings/(Loss) per share Underlying (c) 1.16 1.98 -41% Recurring underlying (c) 1.11 1.25 -11% Reported (c) (0.13) 0.45 N/A Dividend per share First interim 0.34 0.33 +3% Second interim 0.76 0.72 +6% Financial Position At 31st December HK$M HK$M Total equity (including non-controlling interests) 278,427 288,149 -3% Net debt 43,746 36,679 +19% Gearing ratio (a) 15.7% 12.7% +3.0%pt. HK$ HK$ Equity attributable to the Company’s shareholders per share (a), (d) 47.35 48.73 -3% Notes: (a) Refer to glossary on page 215 for definition. (b) A reconciliation between reported (loss)/profit and underlying profit attributable to the Company’s shareholders is provided on page 29. (c) Refer to note 14 to the financial statements for the weighted average number of shares. (d) Refer to note 33 to the financial statements for the number of shares at the year end. FINANCIAL HIGHLIGHTS
 Annual Report 2024 | EN Page 13 Page 15