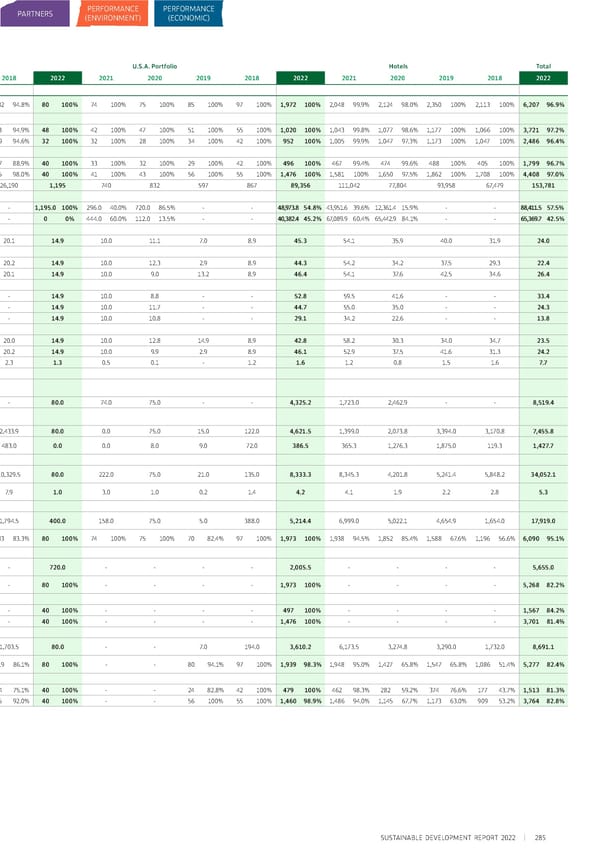
MENUPLACESPEOPLEPARTNERS PERFORMANCE PERFORMANCE (ENVIRONMENT) (ECONOMIC) Performance Data Summary (Social) Hong Kong PortfolioChinese Mainland Portfolio U.S.A. Portfolio Hotels Total 202220212020201920182022202120202019201820222021 2020 2019 2018 2022 2021 2020 2019 2018 2022 Training Total number and percentage of 2,20894.4%2,16592.3%2,22992.1%2,14790.5%1,83077.2%1,94796.6%1,67996.9%1,64798.6%1,57094.7%1,23294.8%80100%74100%75100%85100%97100%1,972100%2,04899.9%2,12498.0%2,350100%2,113100%6,207 96.9% employees received training By gender Male1,42195.7%1,41193.6%1,46492.8%1,40890.4%1,20877.2%1,23296.6%1,06497.6%1,05098.3%99795.8%76394.9%48100%42100%47100%51100%55100%1,020100%1,04399.8%1,077 98.6% 1,177 100% 1,066 100% 3,721 97.2% Female78792.3%75490.0%76590.9%73990.7%62277.3%71596.6%61595.8%59799.0%57393.0%46994.6%32100%32100%28100%34100%42100%952100% 1,005 99.9% 1,047 97.3% 1,173 100% 1,047 100% 2,486 96.4% By management role Management 56398.3%55294.5%57996.8%56298.3%54394.6%70093.2%58593.5%54696.8%47588.6%40788.9%40100%33100%32100%29100%42100%496100% 467 99.4% 474 99.6% 488 100% 405 100% 1,799 96.7% Non-management 1,64593.2%1,61391.6%1,65090.6%1,58588.0%1,28771.7%1,24798.6%1,09498.9%1,10199.5%1,09597.7%82598.0%40100%41100%43100%56100%55100%1,476100%1,581100%1,65097.5%1,862100% 1,708 100% 4,408 97.0% Total training hours 29,70722,48424,29341,86534,25133,52329,51323,71133,12026,1901,195740832597 867 89,356 111,042 77,804 93,958 67,479 153,781 Total training hours by type of training Mandatory16,388.8 55.2% 10,289.1 45.8%7,533.531.0%--21,853.9 65.2% 20,212.7 68.5% 16,332.4 68.9%--1,195.0 100%296.040.0%720.086.5%--48,973.8 54.8% 43,951.6 39.6% 12,361.4 15.9%- - 88,411.5 57.5% Non-mandatory 13,318.644.8% 12,194.9 54.2% 16,759.5 69.0%--11,668.7 34.8% 9,300.5 31.5%7,378.731.1%--00%444.060.0%112.013.5%--40,382.4 45.2% 67,089.960.4% 65,442.9 84.1% - - 65,369.7 42.5% Average training hours By employee12.79.610.017.614.516.617.014.220.020.114.910.0 11.1 7.0 8.9 45.3 54.1 35.9 40.0 31.9 24.0 By gender Male12.38.89.415.913.216.817.714.818.920.214.910.0 12.3 2.9 8.9 44.3 54.2 34.2 37.5 29.3 22.4 Female13.311.011.321.016.916.315.913.121.820.114.910.0 9.0 13.2 8.9 46.4 54.1 37.6 42.5 34.6 26.4 By age group Under 30 years old 13.110.521.1--16.817.514.3--14.910.0 8.8 - - 52.8 59.5 41.6 - - 33.4 30 to 50 years old 15.512.211.1--16.817.314.5--14.910.0 11.7 - - 44.7 55.0 35.0 - - 24.3 Over 50 years old 8.85.44.8--15.314.611.5--14.910.0 10.8 - - 29.1 34.2 22.6 - - 13.8 By management role Management 18.919.020.732.634.814.614.712.522.020.014.910.012.8 14.9 8.9 42.8 58.2 30.3 34.0 34.7 23.5 Non-management 10.76.56.512.97.917.818.315.019.020.214.910.09.9 2.9 8.9 46.1 52.9 37.5 41.6 31.3 24.2 Total training spend (million HK$)3.24.12.93.84.01.62.31.12.72.31.30.50.1 - 1.2 1.6 1.2 0.8 1.5 1.6 7.7 Training by related-topics Information and cyber security related training Total training hours for employees954.8675.8958.8--3,159.5850.61,190.3--80.074.075.0- - 4,325.2 1,723.0 2,462.9 - - 8,519.4 Corporate social responsibility related training Total training hours for employees846.0423.9515.53,570.05,548.01,908.32,111.31,645.24,127.32,433.980.00.075.015.0122.04,621.5 1,399.0 2,073.8 3,394.0 3,170.8 7,455.8 Total training hours for new hires (SD 667.0112.0118.0606.0257.0374.2787.0614.2717.0483.00.00.08.09.072.0 386.5 365.3 1,276.3 1,875.0 119.3 1,427.7 training in induction programme) Health and safety related training Total training hours on health and 9,640.02,867.85,719.811,595.54,342.315,998.815,214.913,876.611,753.910,329.580.0222.075.021.0135.08,333.38,345.3 4,201.8 5,241.4 5,848.2 34,052.1 safety Average training hours on health 4.11.22.44.91.87.98.88.37.17.91.03.01.0 0.2 1.4 4.2 4.1 1.9 2.2 2.8 5.3 and safety per employee Human rights related training Total training hours on human rights 6,320.53,507.03,040.02,910.01,881.35,984.22,568.73,015.61,709.31,794.5400.0158.075.05.0388.05,214.46,999.0 5,022.1 4,654.9 1,654.0 17,919.0 related topics Percentage of employees received 2,12891.0%1,88880.5%2,09786.7%1,95682.4%78733.2%1,90994.7%1,57490.9%1,64598.4%83850.6%1,08383.3%80100%74100%75100%7082.4%97100%1,973100%1,93894.5%1,85285.4%1,58867.6%1,19656.6%6,09095.1% human rights related training Unconscious bias related training Total training hours on unconscious 1,490.0----1,439.5----720.0-- - - 2,005.5 - - - - 5,655.0 bias related topics Percentage of employees received 1,60968.8%----1,60679.7%----80100%-- - - 1,973 100% - - - - 5,268 82.2% unconscious bias related training By management role Management 51189.2%----51969.1%----40100% - - - - 497 100% - - - - 1,567 84.2% Non-management 1,09862.2%----1,08785.9%----40100%- - - - 1,476 100% - - - - 3,701 81.4% Anti-corruption related training Total training hours on anti-1,857.32,446.0684.81,959.0999.83,143.71,901.21,341.41,406.51,703.580.0--7.0194.0 3,610.2 6,173.5 3,274.8 3,290.0 1,732.0 8,691.1 corruption related topics Percentage of employees received 1,33557.1%1,81577.4%1,984(18)82.0%1,94081.8%61726.0%1,92395.4%1,27073.3%1,29277.3%75145.3%1,11986.1%80100%--8094.1%97100%1,93998.3%1,94895.0%1,42765.8%1,54765.8%1,08651.4% 5,277 82.4% anti-corruption related training By management role Management 31655.1%47280.8%526(18)88.0%52692.0%23641.1%67890.3%37660.1%40772.2%25948.3%34475.1%40100%--2482.8%42100%479100% 462 98.3% 282 59.2% 374 76.6% 177 43.7% 1,513 81.3% Non-management 1,01957.7%1,34376.3% 1,458(18)80.0%1,41478.5%38121.2%1,24598.4%89480.8%88579.9%49243.9%77592.0%40100%--56100%55100%1,46098.9%1,48694.0%1,145 67.7% 1,173 63.0% 909 53.2% 3,764 82.8% SUSTAINABLE DEVELOPMENT REPORT 2022 285
 Sustainable Development Report 2022 Page 293 Page 295