
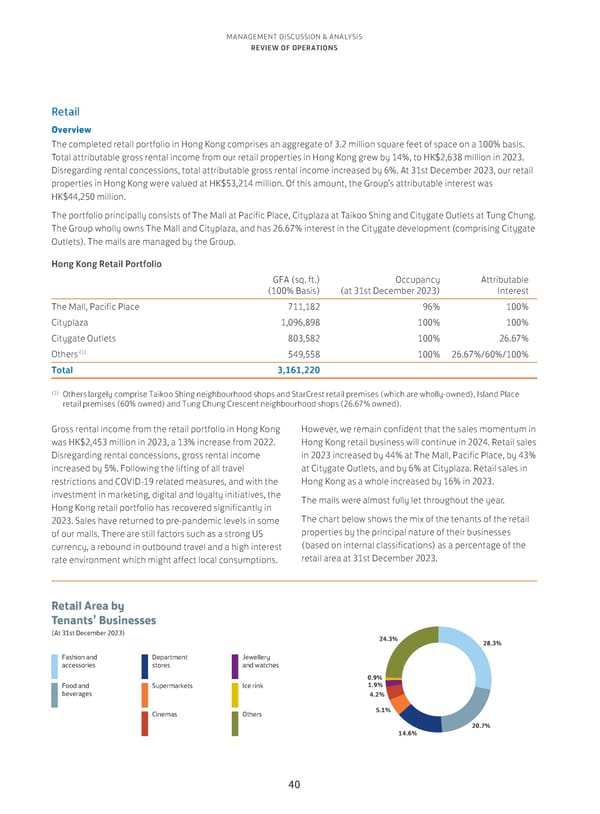
MANAGEMENT DISCUSSION & ANALYSIS REVIEW OF OPERATIONS Retail Overview The completed retail portfolio in Hong Kong comprises an aggregate of 3.2 million square feet of space on a 100% basis. Total attributable gross rental income from our retail properties in Hong Kong grew by 14%, to HK$2,638 million in 2023. Disregarding rental concessions, total attributable gross rental income increased by 6%. At 31st December 2023, our retail properties in Hong Kong were valued at HK$53,214 million. Of this amount, the Group’s attributable interest was HK$44,250 million. The portfolio principally consists of The Mall at Pacific Place, Cityplaza at Taikoo Shing and Citygate Outlets at Tung Chung. The Group wholly owns The Mall and Cityplaza, and has 26.67% interest in the Citygate development (comprising Citygate Outlets). The malls are managed by the Group. Hong Kong Retail Portfolio GFA (sq. ft.) Occupancy Attributable (100% Basis) (at 31st December 2023) Interest The Mall, Pacific Place 711,182 96% 100% Cityplaza 1,096,898 100% 100% Citygate Outlets 803,582 100% 26.67% (1) Others 549,558 100% 26.67%/60%/100% Total 3,161,220 (1) Others largely comprise Taikoo Shing neighbourhood shops and StarCrest retail premises (which are wholly-owned), Island Place retail premises (60% owned) and Tung Chung Crescent neighbourhood shops (26.67% owned). Gross rental income from the retail portfolio in Hong Kong However, we remain confident that the sales momentum in was HK$2,453 million in 2023, a 13% increase from 2022. Hong Kong retail business will continue in 2024. Retail sales Disregarding rental concessions, gross rental income in 2023 increased by 44% at The Mall, Pacific Place, by 43% increased by 5%. Following the lifting of all travel at Citygate Outlets, and by 6% at Cityplaza. Retail sales in restrictions and COVID-19 related measures, and with the Hong Kong as a whole increased by 16% in 2023. investment in marketing, digital and loyalty initiatives, the The malls were almost fully let throughout the year. Hong Kong retail portfolio has recovered significantly in 2023. Sales have returned to pre-pandemic levels in some The chart below shows the mix of the tenants of the retail of our malls. There are still factors such as a strong US properties by the principal nature of their businesses currency, a rebound in outbound travel and a high interest (based on internal classifications) as a percentage of the rate environment which might affect local consumptions. retail area at 31st December 2023. Retail Area by Tenants’ Businesses (At 31st December 2023) 24.3% 28.3% Fashion and Department Jewellery accessories stores and watches 0.9% Food and Supermarkets Ice rink 1.9% beverages 4.2% Cinemas Others 5.1% 20.7% 14.6% 40
 Annual Report 2023 Page 41 Page 43