
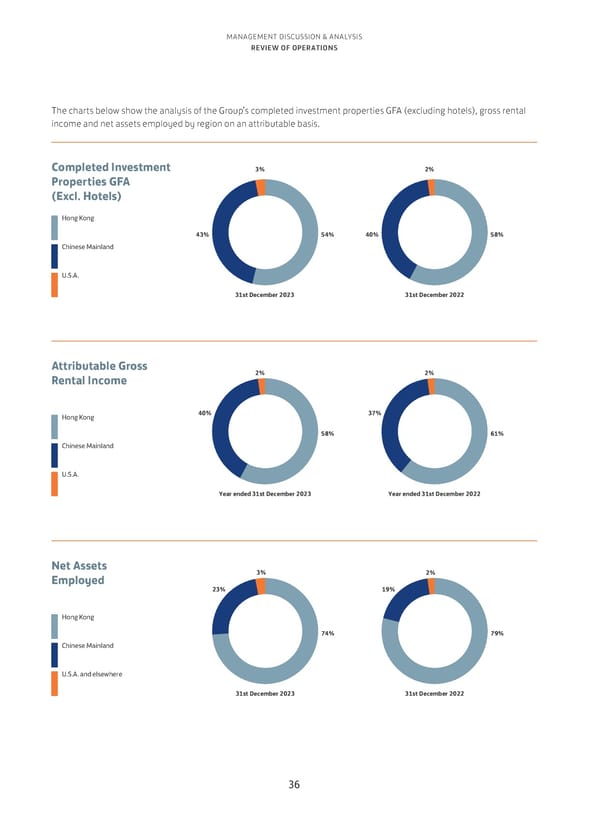
MANAGEMENT DISCUSSION & ANALYSIS REVIEW OF OPERATIONS The charts below show the analysis of the Group’s completed investment properties GFA (excluding hotels), gross rental income and net assets employed by region on an attributable basis. Completed Investment 3% 2% Properties GFA (Excl. Hotels) Hong Kong 43% 54% 40% 58% Chinese Mainland U.S.A. 31st December 2023 31st December 2022 Attributable Gross 2% 2% Rental Income Hong Kong 40% 37% 58% 61% Chinese Mainland U.S.A. Year ended 31st December 2023 Year ended 31st December 2022 Net Assets 3% 2% Employed 23% 19% Hong Kong 74% 79% Chinese Mainland U.S.A. and elsewhere 31st December 2023 31st December 2022 36
 Annual Report 2023 Page 37 Page 39