
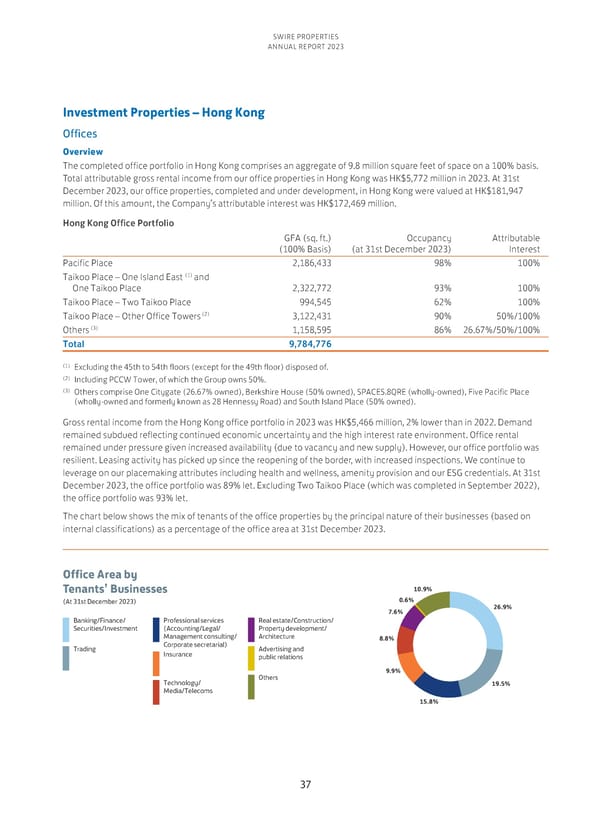
SWIRE PROPERTIES ANNUAL REPORT 2023 Investment Properties – Hong Kong Offices Overview The completed office portfolio in Hong Kong comprises an aggregate of 9.8 million square feet of space on a 100% basis. Total attributable gross rental income from our office properties in Hong Kong was HK$5,772 million in 2023. At 31st December 2023, our office properties, completed and under development, in Hong Kong were valued at HK$181,947 million. Of this amount, the Company’s attributable interest was HK$172,469 million. Hong Kong Office Portfolio GFA (sq. ft.) Occupancy Attributable (100% Basis) (at 31st December 2023) Interest Pacific Place 2,186,433 98% 100% (1) and Taikoo Place – One Island East One Taikoo Place 2,322,772 93% 100% Taikoo Place – Two Taikoo Place 994,545 62% 100% (2) 3,122,431 90% 50%/100% Taikoo Place – Other Office Towers (3) 1,158,595 86% 26.67%/50%/100% Others Total 9,784,776 (1) Excluding the 45th to 54th floors (except for the 49th floor) disposed of. (2) Including PCCW Tower, of which the Group owns 50%. (3) Others comprise One Citygate (26.67% owned), Berkshire House (50% owned), SPACES.8QRE (wholly-owned), Five Pacific Place (wholly-owned and formerly known as 28 Hennessy Road) and South Island Place (50% owned). Gross rental income from the Hong Kong office portfolio in 2023 was HK$5,466 million, 2% lower than in 2022. Demand remained subdued reflecting continued economic uncertainty and the high interest rate environment. Office rental remained under pressure given increased availability (due to vacancy and new supply). However, our office portfolio was resilient. Leasing activity has picked up since the reopening of the border, with increased inspections. We continue to leverage on our placemaking attributes including health and wellness, amenity provision and our ESG credentials. At 31st December 2023, the office portfolio was 89% let. Excluding Two Taikoo Place (which was completed in September 2022), the office portfolio was 93% let. The chart below shows the mix of tenants of the office properties by the principal nature of their businesses (based on internal classifications) as a percentage of the office area at 31st December 2023. Office Area by Tenants’ Businesses 10.9% (At 31st December 2023) 0.6% 7.6% 26.9% Banking/Finance/ Professional services Real estate/Construction/ Securities/Investment (Accounting/Legal/ Property development/ Management consulting/ Architecture 8.8% Trading Corporate secretarial) Advertising and Insurance public relations Others 9.9% Technology/ 19.5% Media/Telecoms 15.8% 37
 Annual Report 2023 Page 38 Page 40