
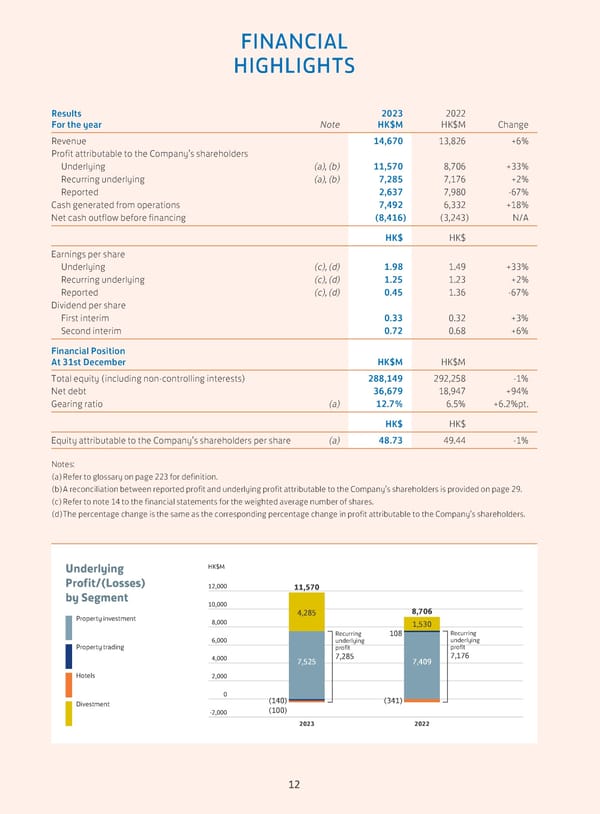
FINANCIAL HIGHLIGHTS Results 2023 2022 For the year Note HK$M HK$M Change Revenue 14,670 13,826 +6% Profit attributable to the Company’s shareholders Underlying (a), (b) 11,570 8,706 +33% Recurring underlying (a), (b) 7,285 7,176 +2% Reported 2,637 7,980 -67% Cash generated from operations 7,492 6,332 +18% Net cash outflow before financing (8,416) (3,243) N/A HK$ HK$ Earnings per share Underlying (c), (d) 1.98 1.49 +33% Recurring underlying (c), (d) 1.25 1.23 +2% Reported (c), (d) 0.45 1.36 -67% Dividend per share First interim 0.33 0.32 +3% Second interim 0.72 0.68 +6% Financial Position At 31st December HK$M HK$M Total equity (including non-controlling interests) 288,149 292,258 -1% Net debt 36,679 18,947 +94% Gearing ratio (a) 12.7% 6.5% +6.2%pt. HK$ HK$ Equity attributable to the Company’s shareholders per share (a) 48.73 49.44 -1% Notes: (a) Refer to glossary on page 223 for definition. (b) A reconciliation between reported profit and underlying profit attributable to the Company’s shareholders is provided on page 29. (c) Refer to note 14 to the financial statements for the weighted average number of shares. (d) The percentage change is the same as the corresponding percentage change in profit attributable to the Company’s shareholders. Underlying HK$M Profit/(Losses) by Segment 12,000 11,570 10,000 8,706 Property investment 4,285 8,000 1,530 Recurring 108 Recurring 6,000 underlying underlying Property trading profit profit 4,000 7,525 7,285 7,409 7,176 Hotels 2,000 0 (140) (341) Divestment (100) -2,000 2023 2022 12
 Annual Report 2023 Page 13 Page 15