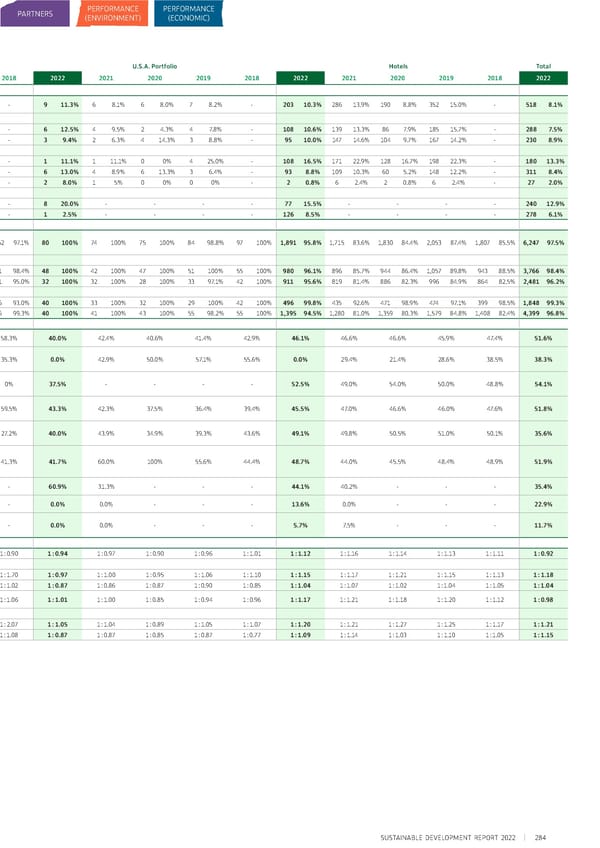
MENUPLACESPEOPLEPARTNERS PERFORMANCE PERFORMANCE (ENVIRONMENT) (ECONOMIC) Performance Data Summary (Social) Hong Kong PortfolioChinese Mainland Portfolio U.S.A. Portfolio Hotels Total 202220212020201920182022202120202019201820222021 2020 2019 2018 2022 2021 2020 2019 2018 2022 Promotion Total number and rate of employees 1546.6%1426.1%964.0%1898.0%-1527.5%1297.4%1207.2%18411.1%-911.3%68.1%68.0%78.2%-20310.3%28613.9% 190 8.8% 352 15.0% - 518 8.1% promotion By gender Male835.6%956.3%694.4%1268.1%-917.1%716.5%706.6%10710.3%-612.5%49.5%24.3%47.8% - 108 10.6% 139 13.3% 86 7.9% 185 15.7% - 288 7.5% Female718.3%475.6%273.2%637.7%-618.2%589.0%508.3%447.1%-39.4%26.3%414.3%38.8% - 95 10.0% 147 14.6% 104 9.7% 167 14.2% - 230 8.9% By age group Under 30 years old268.4%3611.9%257.7%5015.0%-4511.9%298.3%236.4%5610.3%-111.1%111.1%00%425.0%- 108 16.5% 171 22.9% 128 16.7% 198 22.3% - 180 13.3% 30 to 50 years old 1099.4%867.1%595.0%1109.7%-1037.3%947.8%938.1%12428.4%-613.0%48.9%613.3%36.4%- 93 8.8% 109 10.3% 60 5.2% 148 12.2% - 311 8.4% Over 50 years old192.2%202.4%121.3%293.2%-41.8%63.4%42.6%41.1%-28.0%15%00%00% - 2 0.8% 6 2.4% 2 0.8% 6 2.4% - 27 2.0% By management level Management 8414.7%----719.5%----820.0%- - - - 77 15.5% - - - - 240 12.9% Non-management 704.0%----816.4%----12.5%- - - - 126 8.5% - - - - 278 6.1% Performance Review Total number and percentage of employees receiving regular 2,27397.2%2,27697.1%2,34396.8%2,30297.0%2,30297.1%2,00399.4%1,732100%1,671100%1,65699.9%1,26297.1%80100%74100%75100%8498.8%97100%1,89195.8%1,71583.6%1,83084.4%2,05387.4%1,80785.5%6,24797.5% performance review By gender Male1,46998.9%1,48498.5%1,55298.4%1,53298.3%1,53798.2%1,26999.5%1,090100%1,068100%1,04099.9%79198.4%48100%42100%47100%51100%55100%98096.1%89685.7%94486.4%1,05789.8% 943 88.5% 3,766 98.4% Female80494.3%79294.5%79193.9%77094.5%76595.0%73499.2%642100%603100%616100%47195.0%32100%32100%28100%3397.1%42100%91195.6%81981.4% 886 82.3% 996 84.9% 864 82.5% 2,481 96.2% By management role Management 573100%584100%598100%572100%57099.3%73998.4%626100%564100%53599.8%42693.0%40100%33100%32100%29100%42100%49699.8%43592.6% 471 98.9% 474 97.1% 399 98.5% 1,848 99.3% Non-management 1,70096.3%1,69296.1%1,74595.8%1,73096.1%1,73296.4%1,26499.9%1,106100%1,107100%1,121100%83699.3%40100%41100%43100%5598.2%55100%1,39594.5%1,28081.0%1,35980.3%1,57984.8%1,40882.4%4,39996.8% Diversity Females in management positions (as % 52.2%51.7%52.0%51.6%50.7%55.4%58.0%58.0%58.6%58.3%40.0%42.4%40.6%41.4%42.9%46.1% 46.6% 46.6% 45.9% 47.4% 51.6% of total management workforce) Females in senior management positions (as % of total senior 52.0%61.9%61.9%57.1%57.1%29.4%40.0%41.7%46.2%35.3%0.0%42.9%50.0%57.1%55.6%0.0% 29.4% 21.4% 28.6% 38.5% 38.3% management workforce) Females in middle management positions (as % of total middle 65.6%61.8%65.7%66.7%65.6%37.5%28.6%16.7%13.3%0%37.5%--- - 52.5% 49.0% 54.0% 50.0% 48.8% 54.1% management workforce) Females in junior management positions (as % of total junior 51.4%50.7%50.7%50.4%49.5%56.2%58.8%58.8%60.2%59.5%43.3%42.3%37.5%36.4%39.4%45.5% 47.0% 46.6% 46.0% 47.6% 51.8% management workforce) Females in non-management positions (as % of total non-management 31.4%30.4%29.1%28.9%28.6%25.6%25.2%24.9%26.9%27.2%40.0%43.9%34.9%39.3%43.6%49.1% 49.8% 50.5% 51.0% 50.1% 35.6% workforce) Females in management positions in revenue-generating functions (as % of 50.1%52.0%50.2%49.5%49.4%53.2%57.9%64.7%50.0%41.3%41.7%60.0%100%55.6%44.4%48.7% 44.0% 45.5% 48.4% 48.9% 51.9% total revenue-generating management workforce) Females in STEM-related positions (as % 24.7%23.6%---42.5%34.3%---60.9%31.3%-- - 44.1% 40.2% - - - 35.4% of total STEM-related positions) Females in IT-related positions (as % of 32.0%32.5%---21.0%17.9%---0.0%0.0%-- - 13.6% 0.0% - - - 22.9% total IT-related positions) Females in engineering-related positions (as % of total engineering-11.3%11.5%---13.2%9.0%---0.0%0.0%-- - 5.7% 7.5% - - - 11.7% related positions) Gender Pay Ratio (Female to Male)(5) Total workforce1 : 0.841 : 0.811 : 0.791 : 0.781 : 0.781 : 0.791 : 0.781 : 0.731 : 0.751 : 0.901 : 0.941 : 0.971 : 0.901 : 0.961 : 1.011 : 1.121 : 1.161 : 1.141 : 1.13 1 : 1.11 1 : 0.92 By management role Management 1 : 1.051 : 1.031 : 1.051 : 1.021 : 1.041 : 1.401 : 1.481 : 1.451 : 1.441 : 1.701 : 0.971 : 1.001 : 0.951 : 1.061 : 1.101 : 1.151 : 1.171 : 1.211 : 1.15 1 : 1.13 1 : 1.18 Non-management1 : 1.071 : 1.041 : 1.031 : 1.041 : 0.971 : 0.881 : 0.881 : 0.811 : 0.891 : 1.021 : 0.871 : 0.861 : 0.871 : 0.901 : 0.851 : 1.041 : 1.071 : 1.021 : 1.04 1 : 1.05 1 : 1.04 Gender Remuneration Ratio 1 : 0.881 : 0.841 : 0.781 : 0.801 : 0.791 : 0.841 : 0.821 : 0.791 : 0.831 : 1.061 : 1.011 : 1.001 : 0.851 : 0.941 : 0.961 : 1.171 : 1.211 : 1.181 : 1.201 : 1.121 : 0.98 (Female to Male) By management role Management 1 : 1.061 : 1.031 : 0.971 : 0.991 : 1.001 : 1.421 : 1.511 : 1.561 : 1.551 : 2.071 : 1.051 : 1.041 : 0.891 : 1.051 : 1.071 : 1.201 : 1.211 : 1.271 : 1.25 1 : 1.17 1 : 1.21 Non-management 1 : 1.221 : 1.161 : 1.141 : 1.181 : 1.091 : 0.981 : 0.971 : 0.881 : 0.951 : 1.081 : 0.871 : 0.871 : 0.851 : 0.871 : 0.771 : 1.091 : 1.141 : 1.031 : 1.10 1 : 1.05 1 : 1.15 SUSTAINABLE DEVELOPMENT REPORT 2022 284
 Sustainable Development Report 2022 Page 291 Page 293